Endorsement of IFRS Accounting Standards An Approach to Estimating Capital Market Effects
OFFICIAL - PUBLIC
The UKEB requests that all users of the approach outlined in this document acknowledge the UKEB as the originator of the approach.
To provide feedback on the approach please send an email to: [email protected]
The UKEB does not accept any liability to any party for any loss, damage or costs howsoever arising, whether directly or indirectly, whether in contract, tort or otherwise from any action or decision taken (or not taken) as a result of any person relying on or otherwise using this document or arising from an omission from it.
© (2025) All Rights Reserved
- Executive Summary
- 1. Economic Rationale
- 2. Quantitative Approach
- Aim and Limitations
- Structure of the Approach
- Detail of the Approach
- Features Common to the Four Effects
- Cost of Equity
- Increase in Market Capitalisation
- Increase in Market Capitalisation
- Decrease in the Cost of Equity Leading to more Projects Funded through Public Equity
- Cost of Debt
- Combining Cost of Capital Reduction Estimates
- Analysis by Market Segment
- Putting Distribution of implementation costs and the estimated cost of Capital Reductions Together
- 3. Other Contextual Aspects to Consider
- Appendix A: Glossary
- Appendix B: Literature Review
- Appendix C: Equity and Debt Funding in the UK: Background Information
- Appendix D: Assessment of Direct Costs and Benefits
- Appendix E: Other Contextual Aspects
- Reference List
- Contact Us
Executive Summary
The UK Endorsement Board
1The UK Endorsement Board (UKEB) is the standard setter for IFRS Accounting Standards in the UK.
2Statutory Instrument 2019/685 gives statutory powers to the UKEB and sets out the criteria that a standard needs to meet to be adopted for use in the UK. The criteria set the requirements to assess whether a standard is conducive to the long term public good (LTPG) in the UK, and in particular, to consider costs and benefits associated with the adoption of newly issued accounting standards.
Aim of the Report
3This report sets out a quantitative approach to assessing cost of capital reductions, associated with the adoption of a new accounting standard in the UK, that would allow preparers to recover implementation costs in the long run. The approach then sets out a framework to assess whether the results are plausible, by looking at published studies on previously observed cost-of-capital effects and other contextual factors.
4This approach aims to provide the UKEB with an important piece of evidence in the appraisal of costs and benefits to be undertaken when endorsing a standard for use in the UK as part of the long-term public good assessment.
The Approach
5The adoption of new accounting standards typically imposes a direct cost burden on preparers of financial statements, mostly for the direct benefit of users of financial statements. Economic assessments of the adoption of accounting standards typically focus on direct costs and benefits only. However, an assessment based only on direct costs and benefits would ignore the potentially significant indirect economic effects that follow from the use of accounts prepared in accordance with new or revised standards.
6One such indirect effect could arise because better information in financial reporting may lead users to improve their capital allocation. This, in turn, may lead to several indirect benefits to preparers that accrue in the long run: most importantly a potential market-wide reduction in the cost of capital. This effect is explicitly considered in the IFRS Foundation's Conceptual Framework for Financial Reporting, predicted by economic theory, and validated through research.
7The approach considers the effect of introducing an IFRS accounting standard on the cost of capital on public equity and debt markets. It focuses on shareholders/bondholders' wealth already invested in capital, and on entities' opportunity to fund projects through public equity or debt in the future. The approach aims to quantify monetary benefits equivalent in value to preparers' implementation costs, through any of the following four market-level effects:
- An increase in market capitalisation, leading to an increase of shareholders' wealth.
- A decrease in the cost of equity, leading to more projects funded through public equity capital.
- An increase in the outstanding value of listed bonds, leading to an increase of bondholders' wealth.
- A decrease in the cost of debt leading to more projects funded through public debt capital.
8An application of the approach leads to the conclusion that for preparers to recover, for example, £200m of implementation costs, associated with the adoption of a hypothetical new accounting standard for use in the UK, one of the following would be needed:
- An increase of LSEG-level market capitalisation of 0.73 basis points;
- A decrease in the average cost of equity capital of 4.4 basis points;
- An increase in the aggregate outstanding value of bonds issued by UK companies and listed on the LSEG of 1 basis points; or
- A decrease in the average yield-to-maturity of bonds issued by UK companies and listed on the LSEG of 1 basis point.
9In real life, the four effects described may occur concurrently. Therefore, lower absolute amounts for the individual effects could be observed but still add up to be equivalent to the £200 million of implementation costs example.
10In addition, it may be necessary to analyse specific impacts by market segment. For example, when a standard affects only a given industry (e.g. insurance, utilities) or market-wide impacts differ, depending on characteristics such as company size, industry etc.
11The report also sets out the key considerations to assess the plausibility of the results. Firstly, the results are compared against academic studies that have estimated the effects of the adoption of IFRS. They are then assessed against other contextual aspects, to be considered on a case-by-case basis, such as economic conditions at the time of adoption.
Limitations of the Approach
12The UKEB has published this approach to provide transparency to stakeholders and to contribute to the international debate on assessing the impacts of implementing new international accounting standards. The following caveats apply:
- The results are not predictions: the approach is applied ex-ante and is not suitable for making predictions of ex-post securities price trends or cost of capital reductions associated with the implementation of a given standard. Results from its application should not be interpreted as such.
- Only cost of capital effects are considered: the approach does not consider wider third-order effects. For example, this approach does not cater for the possibility that wealthier security holders may increase their consumption or entities that raise funds to invest may increase their output or productivity as a result of implementation of a new accounting standard.
- This is only part of the evidence: results from application of this approach would only form part of the evidence to be considered by the Board to assess whether a standard is conducive to the long-term public good in the UK.
13The Board intends to use this approach on a case-by-case basis. It will only be used after testing whether its use is appropriate and proportionate for consideration of any new accounting standards, or amendments to existing accounting standards, for use in the UK.
1. Economic Rationale
1.1In the UK, like most G20 countries, companies are legally required to provide public information on their financial performance and position through financial reporting in accordance with national or international accounting standards1. The main aim is to improve transparency of information and facilitate the flow of capital. This paper will refer to these legal requirements as "financial reporting regulation".
1.2The need for financial reporting regulation arises because, if left to market forces, entities are not always incentivised to publicly disclose this information so that the wider benefits of a standardised financial reporting are not achieved2. Economic theory suggests that this is because of:
- Information asymmetries: companies' management know more about their own financial performance and position than external parties. Without regulation, companies do not have an incentive to disclose this information to the wider public. It can reveal important information to stakeholders, placing management under pressure.
- Externalities (provision of a public good): publicly available financial reporting enhances transparency of the market as a whole. Companies are only partially rewarded for this transparency which, therefore, is not fully "internalised".
1.3The empirical assessment of costs and benefits associated with financial reporting regulation has, historically, proven difficult for a number of reasons, and many challenges are still experienced nowadays.
1.4The first challenge is the estimation of direct implementation costs for preparers. While the cost items that are affected by financial reporting regulation are well-understood, standard setters and financial regulators face two main hurdles in estimating these costs: obtaining reliable data on such costs from preparers; and collecting big enough samples to generalise the findings.
1.5The second challenge is the assessment of direct benefits for users, such as less time spent analysing financial statements, and their related outcomes, e.g. the quality of earnings forecasts, the efficiency of portfolio allocations, or enhanced quality of credit ratings/solvency assessments.
1.6The ways users benefit from financial reporting regulation are widely studied empirically. However, there is little theoretical research, and research findings have not been consolidated. In addition, the data collected from users generally does not allow a quantification of direct benefits.
1.7The third challenge is the assessment of indirect effects (also referred to as wider economic effects), for which there is little research, and the findings have not been consolidated.
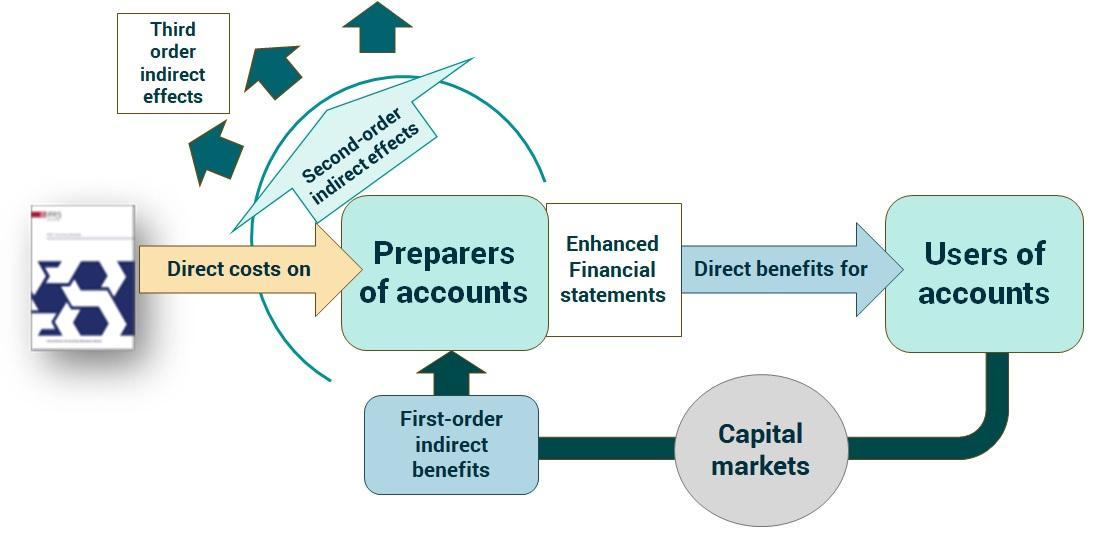
1.8The UKEB identifies the following types of wider economic effects based on research findings (see Appendix B):
- First-order indirect effects (capital market effects): indirect effects triggered by the enhanced interaction between users and capital markets, directly attributable to the change in accounting standards. Examples include: any effects on liquidity or volatility in public equity markets, and on costs of capital. These effects may arise as a result of the adoption of accounting standards.
- Second-order indirect effects (real effects): microeconomic effects that go beyond capital market effects. Examples include: any effects on pricing and competition for preparers3, competition among users, any supply chain considerations arising from accounting changes, or effects on tax obligations, covenants and dividend distribution that arise from changes in accounting line items, performance measures and ratios. These effects may plausibly arise, but are not always anticipated, as a result of the adoption of accounting standards.
- Third-order indirect effects: micro and macroeconomic effects that go beyond microeconomic agents involved in the accounting ecosystems, such as externalities, network effects and macroeconomic effects. It is plausible for these effects to be present. However, they are not always anticipated as a result of the adoption of accounting standards.
1.9Figure 1 provides a visual representation of direct and indirect effects.
Figure 1: Direct and indirect effects associated with the adoption of a new accounting standard
Source: UKEB
1.10The rest of this paper focuses on first-order indirect effects (capital market effects), as indicated by the area circled in red in the chart above. It develops a quantitative approach to help the UKEB assess how capital markets may react to the implementation of a standard, to deliver an indirect monetary benefit that would allow preparers to recover their implementation costs. These are some of the first-order indirect benefits for shareholders and preparers, and a long-run rationale for providing a public good in the form of standardised financial information.
2. Quantitative Approach
Aim and Limitations
2.1This section develops an approach to assess the monetary effects of cost of capital reductions associated with the adoption of new IFRS accounting standards that would allow preparers to recover their implementation costs. It is then possible to assess, separately, the plausibility of such cost of capital reductions, based on the qualitative assessment of the benefits of the new standard under consideration and previous historic assessments that have been undertaken of the actual impact of new standards.
2.2The aim of the approach is to provide the Board with relevant information for its decision-making. The results obtained by applying the approach would provide the Board with a more complete picture of economic effects than an assessment based only on direct costs and benefits4. A change in the cost of capital would have monetary effects on shareholders and preparers, allowing for the estimation of an indirect effect that the Board should consider in their decision-making5.
2.3The following limitations are acknowledged:
- This is only part of the evidence: results of the analysis outlined in this paper would form part of the evidence to be considered by the Board as part of their assessment of whether a standard is conducive to the long-term public good in the UK. The results obtained would be assessed holistically, together with the rest of the evidence collected and would not be the only determinant of whether a standard is conducive to the long-term public good in the UK.
- The application would be assessed on a case-by-case basis: the approach does not have to be used for all endorsement projects. For example, if evidence does not support its application or if it is not proportionate to conduct the analysis. In other words, within the context of an endorsement project, the approach would be used to quantify cost of capital reductions only if stakeholder engagement provides evidence that a given standard delivers direct benefits for users.
- The results are not predictions: the approach is applied ex-ante and is not suitable for making predictions of ex-post securities price trends or cost of capital reductions associated with the implementation of a given standard. Results from its application should not be interpreted as such.
- Break-even analysis: as a general rule, the approach permits a break-even analysis, i.e. the capital market effects that would allow preparers to recover their implementation costs in the long-term. However, it can be calibrated to available evidence to quantify capital market effects that would allow preparers to recover more or less than what they expect to spend on implementation. For example, preparers may only be able to recover part of the costs in cases where users suggest that a standard would only marginally improve their decision-making.
- Preparers will not directly offset their costs: the approach quantifies indirect monetary benefits associated with reductions in cost of capital that would allow preparers to recover their implementation costs in the long run. However, preparers would not directly recover implementation costs through the indirect benefits arising from such capital market effects.
- The approach does not quantify second-order economic effects: an appreciation of stocks/bonds may lead to wider macroeconomic effects, e.g. increased consumption levels. Likewise, enhanced investment associated with a reduction in the cost of capital may also lead to wider macroeconomic effects, e.g. increased output associated with increased investment and/or productivity. These effects are discussed qualitatively but not quantified.
- The approach quantifies market-wide effects: At an individual preparer level, cost of capital reductions arising from the introduction of a new accounting standard are not expected to be uniform, e.g. some entities may experience cost of capital increases. In addition, compliance with a standard may vary by company6. As a general rule, the approach is used to obtain market-level assessments. However, segmental analysis can be used to obtain industry-level assessments (see paragraphs 2.69-2.89).
- The effects identified are not the only ones: Adoption of accounting standards may be associated with a range of indirect benefits, which include anticipated cost of capital reductions. The analysis does not consider other benefits or wider effects beyond the ones included in this report. However, this is done merely for modelling purposes. Other indirect benefits would have to be assessed on a standard-by-standard basis.
- Effects may be transitory: cost of capital reductions may be transitory - they may gradually reduce over time8.
2.4The need for this approach arises from the fact that endorsement assessments are conducted ex-ante, so evidence on expected capital market effects cannot typically be obtained through stakeholder engagement. This is because users of financial statements are generally unable to provide such estimates without having seen the corresponding accounting changes. Therefore, the UKEB has developed an approach to provide a quantitative framework for assessing expectations of likely effects.
Structure of the Approach
2.5Companies use a wide range of external funding sources, though these typically include equity and debt9,10.
2.6The approach focuses only on capital raised through public equity and debt markets11. The reason is twofold:
- Private capital providers (e.g. private equity investors, venture capitalists, lenders, subscribers of private bond placements) typically have access to private information, and rely less on financial statements.
- The legal requirement to apply IFRS rests on companies with equity or debt instruments listed on public capital markets - see Appendix C.
2.7The approach is structured as follows:
- Equity vs debt: the approach looks at both the cost of public equity and debt.
- Stock vs flow: the approach considers the consequences of cost of capital reduction on both:
- the stock of capital, to provide point-in-time evidence; and
- anticipated future capital flows, to provide forward looking evidence, consistent with the UKEB remit of assessing the long term public good in the UK12.
2.8Table 1 delineates this structure:
| Equity | Debt | |
|---|---|---|
| Stock - Securities already issued (wealth effects) | Increase in market capitalisation | Increase in the outstanding value of corporate bonds |
| Flow - Securities to be issued in the future (investment effects) | Decrease in the cost of equity leading to more projects funded through public equity | Decrease in the cost of debt leading to more projects funded through publicly traded corporate bonds |
Source: UKEB
2.9Appendix C contains facts and figures about public equity and debt funding in the UK for added context.
2.10The four effects identified in Table 1 (i.e. effect of cost of capital reductions: on equity stock and flow; debt stock and flow) may take place concurrently13. Weights can be applied to reflect each effect's contribution towards preparers' implementation costs. The magnitude of the weights would vary on a case-by-case basis depending on evidence from stakeholders and other research.
Detail of the Approach
2.11The following sections develop an analysis framework for each of the four effects identified in Table 1 (“the effects” from now onwards).
Features Common to the Four Effects
2.12Regulatory framework for appraisal: The UKEB broadly applies the guidelines for economic appraisal contained in the Better Regulation Framework (BRF) and the Green Book. These guiding principles apply to the evidence produced in accordance with the approach developed in this paper. See Appendix D for further detail.
2.13Counterfactual: for each of the effects, the approach aims to isolate the incremental benefit relative to a counterfactual, i.e. the situation that would prevail in the absence of the introduction of a new accounting standard. Each of the effects analysed below has its own counterfactual, discussed separately. Static counterfactuals were chosen to simplify present value calculations14.
2.14Scenarios: This approach sets out a general framework. Therefore, for each effect, illustrative calculations are based on hypothetical values of total implementation costs. For each of the effects identified, four separate hypothetical scenarios for market-wide implementation costs are assumed, consistent with past evidence on the topic: £50m, £100m, £200m and £500m.
2.15Implementation cost recovery: For each effect, the approach calculates the indirect monetary effects associated with cost of capital reductions that would allow preparers to recover implementation costs as incurred. By default, the figures obtained reflect entities exactly recovering their implementation costs, i.e. a break-even analysis. The amount to be recovered would vary on a case-by-case basis depending on evidence from stakeholders and other research.
2.16Market-wide effects: The approach considers each effect market-wide. More specifically, the approach refers to the implementation costs, the outstanding value of equity/debt capital, capital flows, and cost of capital at a market level. The approach does not cater for the calculation of cost of capital effects at an individual entity level.
Cost of Equity
2.17Cost of equity is defined as the cost of issuing public equity capital on a stock exchange (either a regulated market or a multilateral trading facility) 15.
2.18The methodological framework looks specifically at how cost of equity reductions would affect:
- market capitalisation; and
- equity flows at the point of listing (e.g. IPOs, reverse takeovers) and secondary offerings.
2.19Cost of equity capital reductions may affect other variables, such as the company's capital structure, or dividend distribution. For example, a lower cost of capital may reduce shareholders' pressure to distribute dividends (as they require a lower return to hold their stock), allowing companies more leeway to retain earnings if management deems it appropriate16. These effects are not considered in the analysis for the sake of simplicity.
Increase in Market Capitalisation
2.20Capital raised on public equity markets is publicly traded, with prices of individual stocks fluctuating based on demand and supply, as well as underlying economic factors (e.g. the base rate set by the Bank of England).
2.21Enhanced transparency and comparability brought by a new accounting standard may affect stock prices. Assuming that a standard would bring enhanced transparency and comparability of accounts, sell-side broker dealers would be likely to reduce spreads. At the same time, less-informed investors would be likely to trade more as they possess more information to assess associated risks and rewards, thus increasing liquidity. Increased liquidity would in turn contribute to a lower cost of equity. Assuming that, market-wide, the supply of shares is fixed in the short term, it is expected that the increased demand from investors would lead to higher companies' valuation on public equity markets, resulting in higher market capitalisation 17.
2.22While increases in stock valuations do not accrue any direct monetary value to companies, management and shareholders look closely at the company's stock price because:
- Increases in market valuations represent an increase in shareholders' wealth and are a sign that managers (the agents) are working in shareholders' (the principals') best interests.
- market capitalisation; and
- equity flows at the point of listing (e.g. IPOs, reverse takeovers) and secondary offerings.
2.19Cost of equity capital reductions may affect other variables, such as the company's capital structure, or dividend distribution. For example, a lower cost of capital may reduce shareholders' pressure to distribute dividends (as they require a lower return to hold their stock), allowing companies more leeway to retain earnings if management deems it appropriate16. These effects are not considered in the analysis for the sake of simplicity.
Increase in Market Capitalisation
2.20Capital raised on public equity markets is publicly traded, with prices of individual stocks fluctuating based on demand and supply, as well as underlying economic factors (e.g. the base rate set by the Bank of England).
2.21Enhanced transparency and comparability brought by a new accounting standard may affect stock prices. Assuming that a standard would bring enhanced transparency and comparability of accounts, sell-side broker dealers would be likely to reduce spreads. At the same time, less-informed investors would be likely to trade more as they possess more information to assess associated risks and rewards, thus increasing liquidity. Increased liquidity would in turn contribute to a lower cost of equity. Assuming that, market-wide, the supply of shares is fixed in the short term, it is expected that the increased demand from investors would lead to higher companies' valuation on public equity markets, resulting in higher market capitalisation17.
2.22While increases in stock valuations do not accrue any direct monetary value to companies, management and shareholders look closely at the company's stock price because:
- Increases in market valuations represent an increase in shareholders' wealth and are a sign that managers (the agents) are working in shareholders' (the principals') best interests.
- Management's remuneration is often based on share price performance, either through bonuses or because they are remunerated with shares or shares options18,19.
- Increases in market valuation demonstrate investor confidence in the company's business and management.
2.23An increase in the company's valuation can have second-order economic effects, such as:
- Spillover liquidity effects: an increase in market liquidity may generate further liquidity at a market level, enhancing price discovery.
- Increased consumption: shareholders with higher stakes may increase their consumption levels if they crystallise their capital gains by exiting their investment, or use their greater wealth as collateral to fund long-term consumption.
These are acknowledged but not quantified by the approach.
2.24The following sections develop two alternative methods to assess increases in market capitalisation.
Approach A: Percentage Increase in Market Capitalisation20
2.25Approach A estimates the percentage increase in market capitalisation that would allow preparers to recover market-wide implementation at a given point in time.
2.26Approach A is as follows:
- Step 1 – baseline market cap: Use a point-in-time estimate of the market capitalisation of all listed entities (the counterfactual for this effect).
- Step 2 – incremental market cap: Calculate the marginal increase in market capitalisation required to be equivalent to implementation costs.
2.27Illustrative example, using 2024 as a baseline year:
- Cost of capital analysis inputs:
- LSEG market capitalisation as of October 2024: £2.69 trillion - source: Reuters-Eikon.
- Scenarios: implementation costs of £50m, £100m, £200m and £500m used as a reference point.
- Equivalence to costs: 1:1 (i.e. indirect benefits exactly equivalent to implementation costs).
Figure 2: Market cap increase equivalent to market-wide implementation costs (Bps)
Source: UKEB calculations based on Reuters-Eikon data.
2.29Taking one of the illustrative examples shown, market-wide market capitalisation would need to increase by 0.73 Bps (or 0.0073%) to be exactly equivalent to market-wide implementation costs of £200m.
Approach B: Application of the Gordon Growth Model
2.30Alternatively, the Gordon Growth Model (GGM) can be used to understand how changes in cost of equity can affect stock prices21. The model postulates that the stock price amounts to the PV of all dividends distributed over the life of the stock, discounted by cost of capital net of economic growth. Assuming constant dividends, cost of capital and economic growth, this leads to:
$P = \frac{D}{r-g}$
2.31Resolving for (r-g) and applying market-level estimates, leads to the formula below:
$r-g = \frac{\text{Market – level dividends}}{\text{Market capitalisation}}$
2.32Assuming constant growth, the above equation can be easily used to estimate the reduction in cost of equity associated with an increase in market capitalisation of a given amount.
2.33Approach B is as follows:
- Step 1 – baseline dividends and market cap: Use a point-in-time estimate of the market capitalisation of and dividends distributed by all listed entities (the counterfactual for this effect).
- Step 2 – calculate cost of capital: Divide dividends by market capitalisation to calculate cost of capital (net of growth).
- Step 3 – calculate reduction in cost of capital: Divide dividends by market capitalisation plus estimated implementation costs to calculate an updated cost of capital figure (net of growth).
2.34Cost of capital analysis inputs:
- LSEG market capitalisation of entities distributing dividends as of October 2024: £2.5 trillion - source: Reuters-Eikon.
- Dividends distributed by LSEG listed entities as of October 2024: £100 billion
- Scenarios: implementation costs of £50m, £100m, £200m and £500m used as a reference point.
- Equivalence to costs: 1:1 (i.e. indirect benefits exactly equivalent to implementation costs).
Figure 3: Reduction in the Cost Of Capital Leading to a Market Cap Increase Equivalent to Market-Wide Implementation Costs (Bps)
Source: UKEB calculations based on Reuters-Eikon data.
2.35Taking one of the illustrative examples shown, to obtain an increase in market capitalisation of £200 million, cost of equity would need to decrease by 0.032 Bps (or 0.00032%).
Decrease in the Cost of Equity Leading to more Projects Funded through Public Equity
2.36A reduction in the cost of equity capital would make the net present value of future equity flows, discounted at the current cost of capital, higher. Therefore, companies would be able to embark on a greater number of projects funded through public equity22.
2.37Considering the above, the approach followed for this effect is to estimate the cost of equity reduction that would lead to an increase in the present value of market-wide future equity flows sizeable enough to be equivalent to market-wide implementation costs for preparers.
2.38The counterfactual chosen for the calculation is the prevailing cost of equity at the time of adoption23.
2.39In the literature, cost of equity is typically calculated using either ex-post estimations based on market returns, such as the Capital Asset Pricing Model (CAPM), and ex-ante approaches based on analysts' forecasts, such as the Implied Cost of Capital (ICC)24.
2.40As the UKEB's assessment of LTPG is ex-ante by its nature, this approach uses ICC measures because of it relies on earnings forecast rather than historical data. In addition, they are commonly used in accounting research25. In particular, this paper uses an average of the Price-Earnings Growth (PEG) and Abnormal Earnings Growth (AEG) models as a proxy for the cost of capital26,27.
2.41An increase in the present value of future equity flows leading to more projects funded through equity may have other higher-order effects such as:
- More output due to increased capital: the stock of productive capital funded through equity would increase, contributing to output.
- More output due to increased productivity: the newly funded projects may enhance the productivity of capital, other inputs (e.g. labour) or total factor productivity, contributing to output.
The approach developed in this paper does not allow quantification of second-order economic effects, such as the ones discussed above.
2.42The approach is as follows:
- Step 1 – forecast of capital raised through equity issuances: a market-wide 10-year linear forecast of the value of equity capital expected to be raised on public markets is calculated, based on historical data. The ten-year period is chosen to reflect a mid to long-term investment horizon by entities.
- Step 2 – PV calculation: the present value of the forecast capital offerings is calculated using the baseline cost of equity as the discount rate.
- Step 3 – add implementation costs to PV: hypothetical implementation costs are added to the PV calculation obtained in Step 2 under the different scenarios.
- Step 4 – calculation of the required reduction in the cost of equity: the change in the cost of equity required to achieve the incremental increase in the value of capital raised is calculated.
Illustrative Example using 2024 as a Baseline Year
2.43Cost of equity analysis inputs:
- Cost of equity: 11.23% - source: UKEB calculation based on Reuters-Eikon data28.
- Equity flows: historical time series for the period 2003-2023 taken from the LSEG and forecast linearly for the 2024-2033 period (both primary and secondary offerings). The resulting present value was calculated to be equal to £143 billion (UKEB calculation based on LSEG data).
- Scenarios: implementation costs for £50m, £100m, £200m and £500m used as a reference point.
- Equivalence to costs: 1:1 (i.e. indirect benefits exactly equivalent to implementation costs).
Figure 4: Cost of Equity Reduction needed for an Increase in the Present Value of Market-Wide Future Equity Flows to be Equivalent to Market-Wide Implementation (Bps)
Note: 1Bps = 0.01%. Baseline cost of equity: 11.23% Source: UKEB calculations based on LSEG and Reuters-Eikon data.
2.44Taking one of the illustrative examples shown, market-wide cost of equity capital would have to decrease by 4.4Bps (or 0.044%) for the increase in the value of projects funded through equity to be exactly equivalent to market-wide implementation costs of £200m.
Cost of Debt
2.45Cost of debt is defined as the cost owed to third parties for capital borrowed by issuing fixed income instruments on a regulated market (i.e. issuance of public corporate bonds)29.
2.46This approach looks specifically at how cost of debt reductions may affect:
- the outstanding value of corporate bond liabilities; and
- debt flows through public bond issuances.
2.47Cost of debt reductions may affect other variables, such as the company's capital structure. These variables are not considered in the analysis for the sake of simplicity.
2.48The technical details of the approach with reference to public debt markets are discussed below.
Increase in the Outstanding Market Value of Corporate Bonds
2.49Capital raised on public bond markets is publicly traded, with prices of individual bonds fluctuating based on demand and supply by traders, as well as underlying economic factors (e.g. companies' credit risk, the policy interest rate). In contrast to stocks, bonds carry a contractual obligation to repay principal and interest at maturity. Moreover, it is acknowledged that while some fixed income markets are very liquid (e.g. US treasury market), in general, fixed income instruments do not trade as frequently as stocks30.
2.50More transparent and comparable accounting would lead to an appreciation of traded bonds, on average, and a consequent reduction of yields (i.e. cost of debt), consistent with the arguments made thus far in this report.
2.51The considerations in paragraph 2.23, regarding associated second order economic effects which we do not consider here, broadly apply for this effect too.
2.52The following sections develop two alternative approaches to assessing increases in market capitalisation.
Approach A: Percentage Increase in the Outstanding Value of Bonds31
2.53Approach A estimates the increase in the outstanding value of bonds at a given point in time that would to be equivalent to market-wide implementation costs32.
2.54More specifically, Approach A is as follows:
- Step 1 – baseline outstanding market and face value of bonds: Use a point in time estimate of the market-wide baseline outstanding market and face value of bonds (the counterfactual for this effect);
- Step 2 – incremental change in the outstanding value of bonds: Calculate the marginal increase in the value of baseline outstanding market value of bonds required to be equivalent to market-wide implementation costs.
Illustrative Example using 2024 as a Baseline Year
2.55Cost of capital analysis inputs:
- Outstanding market and face value of bonds: approximately £2 trillion - source: UKEB calculation based on LSEG and Reuters-Eikon data.
- Scenarios: implementation costs for £50m, £100m, £200m and £500m used as a reference point.
- Equivalence to costs: 1:1 (i.e. indirect benefits exactly equivalent to implementation costs).
Figure 5: Increase in Amount Outstanding of Bonds Equivalent to Market-Wide Implementation Costs (Bps)
Source: UKEB calculations based on Reuters-Eikon data.
2.56Taking one of the illustrative examples, the outstanding value of bonds has to increase by 1 Bps (or 0.01%) to be equivalent to market-wide implementation costs of £200m.
Approach B: Yield Reduction Leading to an Increase in the Outstanding Value of Bonds
2.57Approach B estimates the yield decrease needed for an increase in the outstanding value of bonds at a given point in time to be equivalent to market-wide implementation costs33.
2.58More specifically, Approach B is as follows:.
- Step 1 – baseline outstanding market and face value of bonds: Use a point in time estimate of the market-wide baseline outstanding market and face value of bonds (the counterfactual for this effect);
- Step 2 – incremental change in the outstanding value of bonds: Calculate the absolute marginal increase in the value of baseline outstanding market value of bonds required to be equivalent to market-wide implementation costs;
- Step 3 – calculate the cost of capital reduction: Calculate the reduction in yields that would equate to the corresponding increase in the outstanding value of bonds for a given face value.
Illustrative Example using 2024 as a Baseline Year
2.59Cost of capital analysis inputs:
- Outstanding market and face value of bonds: approximately £2 trillion - source: UKEB calculation based on LSEG and Reuters-Eikon data.
- Yield (cost of debt): 4.98%
- Scenarios: implementation costs for £50m, £100m, £200m and £500m used as a reference point.
- Equivalence to costs: 1:1 (i.e. indirect benefits exactly equivalent to implementation costs).
Figure 6: Reduction in the Cost of Debt Leading to an Increase in the Outstanding Value of Bonds Equivalent to Market-Wide Implementation Costs (Bps)
Source: UKEB calculations based on Reuters-Eikon data.
2.60Taking one of the illustrative examples, must decrease by 1.2 Bps for the outstanding value of bonds to increase by £200m.
Decrease in the Cost of Debt Leading to more Projects Funded through Publicly Traded Corporate Bonds
2.61A reduction in the cost of debt capital would increase the net present value of future funding through fixed income, discounted at the current cost of debt. Therefore, companies would be able to embark on a greater number of projects funded through public debt.
2.62Considering the above, the approach followed for this effect is to estimate the increase in the present value of future market-wide debt flows resulting from a reduction in the cost of debt, that would be enough to be equivalent to market-wide implementation costs for preparers.
2.63The counterfactual chosen to calculate incremental benefits accruing to preparers through bond issuances, as a result of reduction in the cost of debt, is the average yield-to-maturity on publicly traded corporate bonds issued by UK entities.34
2.64The considerations in paragraph 2.34 broadly apply for this effect too.
2.65The approach is as follows:
- Step 1 – forecast of debt issuances: a market-wide 10-year linear forecast of the value of capital projected to be raised through corporate bond issuances is calculated, based on historical data35. The ten-year period is chosen to reflect a mid- to long-term investment horizon by entities.
- Step 2 – PV calculation: the present value of these capital offerings is calculated using the baseline cost of debt as the discount rate.
- Step 3 – add implementation costs to PV: hypothetical implementation costs are added to the PV calculation obtained in Step 2 under different scenarios.
- Step 4 – calculation of the reduction in cost of debt: the change in the cost of debt (%) required to achieve the incremental increase required in the present value of capital raised is then calculated.
Illustrative Example using 2024 as a Baseline Year
2.66Model inputs:
- Cost of debt (average yield on corporate bonds): 5.03% - source: UKEB calculation based on Reuters-Eikon data36.
- Issuance of corporate bonds: historical time series for the period 2014-2023 taken from Reuters-Eikon and forecast linearly for the 2024-2033 period. The resulting PV was calculated to be equal to £491.75 billion (UKEB calculation based on Reuters-Eikon data).
- Scenarios: implementation costs for £50m, £100m, £200m and £500m used as a reference point.
- Equivalence to costs: 1:1 (i.e. indirect benefits exactly equivalent to implementation costs).
Figure 7: Cost of Debt Reduction needed for an Increase in the Present Value of Market-Wide Future Bond Flows to be Equivalent to Market-Wide Implementation (Bps)
Source: UKEB calculations based on Reuters-Eikon data.
2.67Taking one of the illustrative examples, the market-wide cost of debt capital would have to decrease by 1Bp (or 0.01%) for the value of projects funded through bonds to exactly equate to market-wide implementation costs of £200m.
Combining Cost of Capital Reduction Estimates
2.68The four effects discussed above may happen concurrently. As a consequence, it is possible to estimate how the different indirect benefits could contribute towards equating a share of implementation costs. Weights would be attributed based on several factors (e.g. stakeholders' feedback, nature of the requirements, economic conditions, IFRS at the time of adoption).
Analysis by Market Segment
2.69An analysis by market segment (also known as distributional analysis) looks at the differential effect of an intervention across subgroups of a population.
2.70In the case of an accounting standard, this may refer to differential impacts across entities of different sizes or other characteristics, such as industry/sector, levels of reporting quality, adherence to corporate governance requirements.
2.71The following section discusses an example of segmental analysis by size.
Example: Segmental Analysis by Company Size
2.72IFRS accounting standards largely affect listed companies, typically mature businesses that have reached a size and complexity that allows them to comply with the disclosure and governance requirements of listing. However, there are listed entities which are relatively small, both in terms of the number of employees and/or revenues.
2.73Moreover, companies listing on the Alternative Investment Market (AIM) are typically smaller, early-stage, businesses in need of equity funding to support their growth. On average, smaller-cap companies have limited resources dedicated to technical accounting, internal audit and interaction/advocacy with standard setters. Therefore, it is important to consider distributional effects for smaller-cap companies when conducting a cost-benefit assessment to duly represent the range of UK stakeholders, and in compliance with the BRF.
2.74To assess how cost of capital reductions may affect companies of different sizes, two inputs are needed:
- the distribution of implementation costs; and
- the distribution of baseline cost of capital and capital raised.
Distribution of Costs
2.75Accounting standards may affect companies differently upon implementation:
- In some cases, implementation costs are proportionate to the size of their operations, for example because a standard affects recognition and measurement (e.g. IFRS 16), and, therefore, has one-off or ongoing effects on individual journal entries. In that case, implementation costs may be proportionate to company size.
- On the other hand, if a standard affects only presentation, or adds disclosures (e.g. IFRS 18), implementation costs may be less correlated with the size of operations. As a consequence, companies may be affected more uniformly, regardless of their size.
2.76An example clarifies this.
2.77Fact pattern: it is estimated that accounting standard IFRS XX, with future implementation in year 202X, will be associated with market-level implementation costs of £100m. Two extreme scenarios may be imagined:
- In Scenario 1, costs are fully proportionate to companies' revenues;
- In Scenario 2, costs are not related to revenues at all, i.e. each company spends the same amount.
2.78There are roughly 1,400 listed entities that apply IFRS in the UK. For simplicity, it is assumed that the FTSE100 accounts for 80% of the revenues, that the FTSE250 accounts for 15% of the revenues, and that the rest of the market accounts for 5% of the revenues.
2.79The distribution of costs would be as follows:
| FTSE100 | FTSE250 | Rest of the market | |
|---|---|---|---|
| Scenario 1 costs: proportionate to revenues | £80m | £15m | £5m |
| Scenario 2 costs: no relationship with revenues | £7m | £18m | £75m |
Source: UKEB
2.80The example shows that if companies are likely to face costs that are independent on the entity's size, the burden would fall mainly on smaller entities, both in terms of aggregate cost burden and as a share of their operating costs.
Distribution of Cost of Capital and Capital Raised
2.81Cost of capital is generally correlated with company size. Smaller companies may be younger and, therefore, have a shorter public reporting history. In addition, they tend to have less coverage by analysts/researchers. Their instruments tend to be less traded, less liquid and characterised by wider spreads. As a consequence, companies of smaller size are expected to be characterised by higher cost of capital. An analysis of cost of equity capital for UK companies over the 2002-2007 period confirms this:
| Assets | Cost of equity |
|---|---|
| Bottom 25% | 16.41% |
| Between 25% and 50% | 14.38% |
| Between 50% and 75% | 12.30% |
| Top 25% | 10.68% |
Source: UKEB calculation based on Reuters-Eikon data
2.82In addition, smaller-capitalised entities raise less funding than larger companies on capital markets. An analysis of LSEG data helps contextualise this point:
Table 3: Distribution of Capital Raised by Market
| Year | Capital raised – £ million | Capital raised – share |
|---|---|---|
| Main market | AIM | |
| 2020 | 29,086.96 | 5,272.33 |
| 2021 | 19102.66 | 6872.91 |
| 2022 | 6895.69 | 2226.70 |
| 2023 | 6665.74 | 1540.22 |
Source: UKEB calculation based on LSEG data
2.83These features should be considered in the distributional analysis.
Putting Distribution of implementation costs and the estimated cost of Capital Reductions Together
2.84An illustrative example clarifies how the distributional analysis would be performed.
2.85Fact pattern: It is estimated that accounting standard IFRS XX, with future implementation in year 202X, will be associated with market-level implementation costs of £100m.
|:-------|:---------------| | Bottom 25% | 16.41% | | Between 25% and 50% | 14.38% | | Between 50% and 75% | 12.30% | | Top 25% | 10.68% |
Source: UKEB calculation based on Reuters-Eikon data
2.82 In addition, smaller-capitalised entities raise less funding than larger companies on capital markets. An analysis of LSEG data helps contextualise this point:
Table 3: Distribution of Capital Raised by Market
| Year | Capital raised – £ million | Capital raised – share |
|---|---|---|
| Main market | AIM | |
| 2020 | 29,086.96 | 5,272.33 |
| 2021 | 19102.66 | 6872.91 |
| 2022 | 6895.69 | 2226.70 |
| 2023 | 6665.74 | 1540.22 |
Source: UKEB calculation based on LSEG data
2.83 These features should be considered in the distributional analysis.
Putting Distribution of implementation costs and the estimated cost of Capital Reductions Together
2.84 An illustrative example clarifies how the distributional analysis would be performed.
2.85 Fact pattern: It is estimated that accounting standard IFRS XX, with future implementation in year 202X, will be associated with market-level implementation costs of £100m.
2.86 For simplicity, only the effect of cost of capital reductions on projects funded through equity is considered. In the example, UKEB calculations allow us to conclude that implementation costs, cost of capital and future equity issuances are distributed as follows (figures are purely hypothetical):
Table 4: Distribution of Implementation Costs, Cost of Capital and Future Equity Issuances
| FTSE100 | FTSE250 | Rest of the market | |
|---|---|---|---|
| Implementation costs | £60m | £30m | £10m |
| Baseline cost of capital | 10% | 12% | 14% |
| Capital raised, forecast, next 10 years | £10 billion | £ 5 billion | £ 1 billion |
| Capital raised, NPV | £61.5 billion | £28.3 billion | £ 5.2 billion |
Source: UKEB calculation based on LSEG and Reuters-Eikon data
2.87 Applying the approach described in paragraphs 2.25-2.32, it is calculated that, to be equivalent to implementation costs, cost of equity would need to go down by:
- 2.3 Bps for FTSE 100 companies;
- 2.6 Bps for FTSE 250 companies;
- 4.9 Bps for the rest of the market.
2.88 Application of the approach to the LTPG assessment will be conducted:
- At a market level in all circumstances (i.e. by applying the approach described in paragraphs 2.8-2.51); and
- To different market segments (e.g. by size, by industry) when stakeholder engagement suggests that some segments may be disproportionately affected by the standard (i.e. by applying the distributional analysis described in paragraphs 2.52-2.70).
2.89 When conducting the distributional analysis for a standard, the distribution of implementation costs, cost of capital and future equity issuances will be assessed on a case-by-case basis.
3. Other Contextual Aspects to Consider
3.1 This section discusses other contextual aspects that need consideration when applying the approach developed in Section 2 within the context of an endorsement project.
Inputs to be Collected through Survey Evidence
3.2 The implementation of the approach within the context of an individual LTPG assessment for an endorsement project:
- may use market-wide implementation costs for preparers as a reference point; and
- relies on an assessment of whether the standard is likely to enhance users' decisions overall, making a market-wide cost of capital reduction plausible.
3.3 Information on implementation costs for preparers and direct benefits to users is typically collected through survey evidence. The proportionality of collecting data by means of a survey is assessed on a project-by-project basis37.
3.4 Appendix D contains a standardised framework to estimate preparers' implementation costs and guidance to assess direct benefits to users by means of a survey, where the Board considers it proportionate to use this approach as part of the evidence to support an endorsement assessment.
Plausibility of the Estimates
3.5 Estimates may be compared with similar research results.
3.6 The UKEB conducted a review of the literature (reported in Appendix B) and concluded that there are no direct quantitative estimates with which to compare the cost of capital analysis estimates. This is because the approach developed in this report and existing research have addressed partially different issues:
- This approach considers cost of capital reductions associated with the adoption of an individual accounting standard in the UK. It also considers both equity and debt cost of capital.
- Most of the existing literature focuses instead on the relationship between IFRS and cost of capital focuses on the cross-jurisdictional effect on cost of equity capital associated with the adoption of IFRS in 2005.
3.7 However, it should be noted that the scale of the implementation costs and associated benefits involved with the adoption of full IFRS in 2005 by entities in the EU would logically have led to much larger capital market effects than those expected to be associated with implementation of an individual standard. Therefore, the approach only aims to use the results from that literature to conduct a preliminary and approximate sense-check of the plausibility.
3.8 Recent research published by the Australian Accounting Standards Board (AASB) that isolates a correlation between the adoption of individual accounting standards and cost of capital supports the approach taken in this paper.
Reduction in Cost of Equity Estimates
Results from Adoption of IFRS in 2005
3.9 Based on the literature review discussed in Appendix B, the UKEB developed a simple regression model to extract a quantitative estimate to use for the comparison.
3.10 Based on the analysis, the likely cost of capital reduction associated with the adoption of IFRS in 2005 in the UK was approximately 100 Bps. The result was cross validated using the relevant literature.
3.11 Cost of equity estimates obtained using the approach described in Section 2 would be compared with the range estimate above for an approximate sense-check of their plausibility.
3.12 The detailed analysis and cross-validation are described in Appendix E.
Results from Adoption of IFRS 15 and IFRS 16 in Australia
3.13 The AASB published an academic paper looking at the impact of adopting IFRS 15 and IFRS 16 on cost of equity in Australia. The paper considers the ex-post impacts and can be accessed here.
3.14 The main finding of that paper is that IFRS 15 and IFRS 16 (adopted at the same time and assessed jointly) were associated with a cost of capital reduction in the range of 1.3% and 1.9% for ASX-listed companies over the 2015-2020 period.
3.15 Like most papers on the topic, its main limitation is that inference is not causal. Therefore, the results are interpreted as correlations. In addition, the sample is biased towards larger companies. On balance, the presence of an effect is credible despite the limitations of the paper.
3.16 The results of the UKEB approach may be compared with the AASB results, whilst acknowledging that they relate to another jurisdiction and considering the limitations identified above.
Cost of Debt Comparison Estimate
3.17 As noted, the evidence on public debt markets is much more limited than that on public equity markets.
3.18 The main paper looking at the effect of IFRS adoption on public debt funding is Florou and Kosi (2015), who look at a global sample of firms between 2000 – 2007. The authors measure the cost of debt in the public market (bond market) as the basis point spread over a government bond issued by the same country with a comparable maturity in the same currency. They find that IFRS adoption led to a decrease in bond yield spreads by approximately 37 Bps relative to non-adopters.
3.19 In the absence of other contributions, the amount discussed in Florou and Kosi (2015) is used as a quantitative benchmark for cost of debt reductions at the time of IFRS adoption.
Qualitative Assessment of Other Issues
3.20 This section discusses other issues that may be considered in order to contextualise the results more effectively.
IFRS in use at the Time of Adoption
3.21 To assess the plausibility of the cost of capital estimates, one may have to consider IFRS in use at the time of the introduction of the standard being adopted. This is because as the number of IFRS requirements grows and IFRS covers an increasing number of transactions, the cost of capital effect associated with the introduction of an individual standard could be affected. In addition, interactions between the new and existing standards should be considered.
Regulatory and Economic Conditions at the Time of Adoption
3.22 To assess the plausibility of the cost of capital estimates, one may have to consider regulatory and economic conditions at the time of endorsement38.
3.23 Relevant economic indicators should be considered on a case-by-case basis. These may include the real economy outlook, inflation, monetary policy, as well as capital market indicators, including cost of capital. For example:
- Day-to-day volatility of market capitalisation and/or outstanding value of corporate bonds, to assess whether the size of anticipated capital market effects is in line with the size of normal market fluctuations.
- Capital markets outlook, as, for example, anticipated periods of heightened market volatility would impact cost of capital.
- Inflation outlook, as inflation determines monetary policy and interest rates, the latter being the most important component of cost of debt.
3.24 Regulatory developments and outlook may also be considered on a case-by-case basis, such as regulation pertaining to capital markets, market structure, financial stability and investors' protection.
3.25 An assessment on how regulatory and economic conditions at the time of adoption may influence the results may be included for consideration by the Board, when providing context for the cost of capital reduction estimates. This would be assessed on a case-by-case basis.
Appendix A: Glossary
| Term | Description |
|---|---|
| AASB | Australian Accounting Standards Board |
| AEG | Abnormal Earnings Growth |
| AIM | Alternative Investment Market |
| BCR | Benefit-to-cost ratio |
| Bps | Basis points |
| BRF | Better Regulation Framework |
| CAPM | Capital Asset Pricing Model |
| FCA | Financial Conduct Authority |
| IASB | International Accounting Standards Board |
| ICC | Implied Cost of Capital |
| IFRS | International Financial Reporting Standard |
| IPO | Initial Public Offering |
| LSEG | London Stock Exchange Group |
| LTPG | Long-term Public Good |
| PEG | Price Earnings Growth |
| PSM | Professional Securities market |
| PV | Present Value |
| SI | Statutory Instrument |
| UKEB | UK Endorsement Board |
Appendix B: Literature Review
B1. This Appendix reviews empirical academic research on the relationship between IFRS and cost of capital39. The purpose is twofold:
- To contextualise the study: an analysis of the extant literature shows whether on average IFRS adoption and/or accounting standards are associated with a reduction in the cost of capital as noted in the Conceptual Framework.
- To provide a benchmark to see if the results obtained from the cost of capital analysis are plausible (see Section 3).
Financial Reporting and Cost of Capital: Theory
B2. The greater transparency and comparability brought by enhanced financial reporting should directly benefit primary users of financial statements, defined in the Conceptual Framework as “existing and potential investors, lenders and other creditors" (IASB, 2018, paragraph 1.2). Equity and fixed income investors use financial information to make investment decisions, or, to use the language of the Conceptual Framework, "make decisions relating to providing resources to the entity" (IASB, 2018, paragraph 1.2).
B3. Better financial information should, in principle, enhance decision-making in the investment, lending and trading ecosystem. In detail, better information would help40:
- investors assess risks and rewards and, therefore, create better portfolios and maximise their returns;
- analysts enhance the accuracy of their earnings forecasts;
B4. Enhanced decision-making by users of financial statements should lead to a decrease in the cost of capital, as also noted in the Conceptual Framework for Financial Reporting (IASB, 2018, paragraph 2.41). The chain of events that leads to a reduction in the cost of capital in equity markets is well-understood from a theoretical perspective. Enhanced financial reporting provides traders with additional information, attracting more capital from less informed investors and lowering the risk of holding a given stock. This leads to enhanced trading activity and a reduction in bid/ask spreads, i.e. an increase in liquidity. As a result, traders demand lower returns for holding their stocks41.
B5. A better functioning, liquid market, in which securities are priced efficiently, in turn leads to a lower cost of capital for companies accessing funds at the time of listing or through secondary issuances of capital. Comparable arguments can be made for public debt markets42,43.
B6. This review focuses on the specific topic of the effect of IFRS (both IFRS as a whole and individual standards) on cost of capital, covering both equity and debt44.
Review of the Empirical Literature
B7. The review of the literature focuses, firstly, on research that considers the effect of adopting the body of IFRS accounting standards in 2005 in many jurisdictions including the UK, and then on research that assesses the impact of individual accounting standards on cost of capital45.
B8. Research focusing on cost of equity and debt are discussed separately. Studies focusing solely on voluntary adoption are excluded from the analysis as they are not deemed relevant for the work of the UKEB (which has a mandate to consider adoption of standards for mandatory reporting) and because results on voluntary adoption are typically characterised by self-selection bias.
IFRS Adoption in 2005 and Cost of Equity
Overall Summary of Findings
B9. Most papers on the topic are cross-jurisdiction studies, though some contributions focus on individual countries. The papers reviewed deploy various empirical strategies grounded in econometrics, and most contributions do not apply techniques that allow to isolate causal relationships.
B10. The studies, on average, find that the adoption of IFRS in 2005 was associated with a reduction in the cost of capital, suggesting the presence of a robust empirical regularity. Estimates of the relationship between mandatory introduction of IFRS in 2005 are, however, very diverse, ranging from as little as 26 basis points (Bps) to as much as 160 Bps.
B11. The relationship identified in the literature:
- is stronger in certain jurisdictions than others, typically common-law countries with strong institutions and rule-of-law, such as the UK;
- is sometimes dependent on the benchmark group of companies used;
- may be only transitory, that is, the effect may dissipate with time;
- may be affected by users' expectations and materialise even before adoption.
B12. Overall, the literature analysing the effect of IFRS Accounting Standards on the cost of equity provides evidence that IFRS contributes to a lower cost of equity capital, consistent with the results in the systematic review by Opare, Houqe and Van Zijl (2021).
Brief Summaries of Individual Studies
B13. This section provides brief summaries of the studies reviewed, presented in chronological order (publication date).
B14. Palea (2007) investigates whether adoption of IFRS in 2005 was associated with a reduction in cost of capital using quarterly reports for a sample of 35 European financial institutions (excluding the UK), between 2004 and 2005. The study finds that IFRS adoption was associated with a reduction in the cost of equity, supporting the hypothesis that IFRS requirements improves the information available to investors and in turn is associated with lower cost of equity.
B15. Hail and Leuz (2007) considers the effect of mandatory IFRS adoption on European countries (including the UK), between 2001 and 2005. This study finds evidence for a reduction in the cost of capital for firms that mandatorily adopted IFRS in 2005. However, the authors caveat that their findings have a small magnitude, are sensitive to the companies used as a control group and may, in part, be explained by the introduction of regulation concurrently with IFRS adoption. Finally, the authors caution that investors may have priced in the impact of the mandate before it became effective.
B16. Christensen, Lee and Walker (2008) assess the impact of IFRS adoption on the cost of equity for companies in 17 European countries (including the UK). The study concludes that IFRS is associated with a lower cost of capital in countries with high-quality institutional characteristics46. In the UK, the study finds IFRS adoption to be associated with a reduction in the cost of capital between 113 BPs and 193 BPs.
B17. Daske, Hail, Leuz and Verdi (2008) assess the effect of IFRS adoption on a global sample of companies (including UK ones) who either voluntarily or mandatorily adopted IFRS, between 2001 and 2005. It uses a quasi-experimental empirical design to conduct the analysis and found that IFRS adoption is associated with a 26 Bps reduction in the cost of equity in 2004, the year prior to IFRS becoming effective. The study suggests this as evidence of markets pricing the effect of IFRS in advance, but cautions that the findings are stronger in countries with relatively strict enforcement regimes and institutional environments. In addition, it notes that concurrent changes to policies make it difficult to isolate the true effect of IFRS implementation.
B18. Li (2010) investigates whether the introduction of IFRS in 2005 led to a reduction in the cost of capital using a sample of European companies (including the UK), between 1995 and 2006. The study notes that IFRS adoption led to a 63Bps reduction in the cost of equity. Like the previous studies, it finds that the reduction in the cost of equity only occurred in countries with strong institutional environments.
B19. Gkougkousi & Mertens (2010) investigates whether adoption of IFRS in 2005 was associated with a reduction in cost of capital by analysing a sample of 236 European banks and insurance companies (17% of the sample comprised UK companies), between 2002 and 2007. The study finds that IFRS adoption by banks and insurance companies was associated with an 80 Bps reduction in the cost of equity.
B20. Daske, Hail, Leuz and Verdi (2013) investigates the impact of IFRS on the cost of equity depending on companies' level of compliance with the requirements. Using a global sample of companies (including UK companies), between 1988 and 2004 the study classifies companies as either 'serious' adopters, those implementing the standards as part of serious commitment to increasing transparency, or 'label' adopters, ones that viewed IFRS as a tick-box exercise and made minimal changes to their reporting policies. The study finds that 'serious' adopters experienced a significantly larger decrease in the cost of capital relative to 'label' adopters, confirming their hypothesis.
B21. Hoque, Monem and Van Zijl (2016) evaluates the impact of voluntary and mandatory IFRS adoption of IFRS Accountings Standards in New Zealand, between 1998 and 2009. The study finds a significant negative association between IFRS adoption and the implied cost of equity, both for firms which adopted IFRS voluntarily and for those which adopted IFRS after it became mandatory to do so.
B22. Castillo-Merino, Menendez-Plans, and Orgaz-Guerrero (2014) estimates a regression model to determine the association between IFRS and the cost of equity for Spanish companies, between 1999 and 2009. The study found that IFRS was associated with a 150bps reduction in the cost of equity, although the study highlights the likely impact of the joint effect of IFRS adoption and enhanced enforcement mechanisms as a possible confounding factor.
B23. Persakis and Iatridis (2016) uses a sample of companies in the Euro Zone and Asia and assesses the effects of IFRS adoption, the level of investor protection and earnings quality on the cost of capital. In the period between 2000 and 2014, the study finds a negative association (130 Bps reduction) between IFRS adoption and the cost of capital.
Impact of Individual Standards on Cost of Equity
Overall Summary of Findings
B24. To the best of our knowledge, few studies look at the impact of individual IFRS accounting standards on cost of capital at the time of adoption. Two focus on the impact of IFRS 8 Operating Segments. A study, published in 2025, by the AASB focuses on the introduction of IFRS 15 Revenues from Contracts with Customers and IFRS 16 Leases in Australia and New Zealand.
B25. Relatively more contributions look, instead, at how entities comply with the requirements of individual accounting standards after adoption (but not at the time of adoption). They find that stricter compliance is generally associated with lower cost of equity47.
B26. Relatively little evidence on the relationship between individual accounting standards and cost of equity means that the UKEB could not extract a quantitative benchmark estimate associated with a generic individual standard. This affected the chosen approach for assessing the plausibility of the results (see Section 3)48.
Brief Summaries of Individual Studies
B27. This section provides brief summaries of the studies reviewed, presented in chronological order (publication date).
B28. Paugam and Ramond (2015) considers the impact of the disclosure requirements of IAS 36 - Impairment on cost of equity. It computes the 'disclosure scores' based on the level of compliance for a sample of French companies, between 2006 and 2009. The main finding is that a one-point increase in the IAS 36 disclosure score was associated with a 35bps reduction in the cost of capital in the sample period considered.
B29. Mazzi, Andre, Dionysiou and Tsalavoutas (2017) considers the impact of compliance with goodwill-related disclosure requirements as set out in IFRS 3 and IAS 36 on the implied cost of equity. For a sample of European companies, between the years 2011 – 2019, the study finds that a higher level of compliance with the disclosure requirements was associated with lower cost of equity. Like many other studies, their findings only hold in countries with strong institutional environments.
B30. Pavlopoulos & Iatridis (2023) uses a global sample, between 2011 and 2019, and assesses the impact of IFRS 3 on the cost of equity. With respect to the cost of equity, the study finds that high-quality IFRS 3 disclosures were associated with a lower cost of equity in the sample period. Like in other studies, this finding only holds true in countries with strong legal and political environments.
B31. Lenormand and Touchais (2021) evaluates the impact of IFRS 8 – Segment Reporting on the cost of equity in France. Using a sample of 250 companies listed on Euronext Paris, the study reports that the introduction of IFRS 8 was associated with a 37 BPs reduction in the cost of capital in the post-adoption period among companies that present more aggregated information.
B32. Saleh, Aboud and Eliwa (2022) evaluates the impact of IFRS 8 – Segment Reporting on the cost of equity and the cost of debt. The sample comprises European companies and covers the period between 2007 - 2011. The study finds no change in the cost of equity or the cost of debt following the adoption of IFRS 8. The paper suggests that this is because companies already provided segmented information under the accounting standard which preceded IFRS 8, namely IAS 14.
B33. Hanlon and Truong (2025) looks at the impact of adopting IFRS 15 and IFRS 16 on cost of equity in Australia and New Zealand. The main finding is that IFRS 15 and IFRS 16 (same-period adoption) were associated with a cost of capital reduction between 1.3% and 1.9% for ASX-listed companies over the 2015- 2020 period. The study does not use a causal inference approach to derive their findings.
Impact of IFRS on the Cost of Debt
B34. The literature assessing the effect of the adoption of International Accounting Standards on the cost of debt is relatively limited and mixed in its conclusions.
B35. Four studies were found that test the effect of the adoption of International Accounting Standards on the cost of debt. Two studies find that IFRS is associated with a reduction in the cost of debt in both public debt markets (Florou & Kosi, 2015) and private debt markets (Kim et al, 2011).
- Kim, Tsui and Yi (2011) investigates the impact of IFRS adoption on the cost of debt for a global sample of firms. The study finds that banks charged lower loan rates to IFRS adopters relative to non-adopters. In particular, the study provides evidence that IFRS adopters experienced a decrease in loan rates between 20 Bps and 31 Bps. Unlike most other studies, the study argues that the findings are not affected by institutional characteristics.
- Florou and Kosi (2015) considers the impact of IFRS on debt financing, taking a global sample of firms between 2000 – 2007. The study finds that IFRS adoption led to a decrease in bond yield spreads by 36 Bps relative to non-adopters. However, the cost of loans in the private market (i.e., loan spreads) remained relatively unchanged.
B36. One study finds that entities that adopted IFRS experienced an increase in interest rates relative to entities which did not adopt the standards (Chen et. al, 2015). Consistent with this finding, a separate study finds that the adoption of IFRS leads to a reduction in the contractability of financial information used in debt contracts, thereby increasing lenders monitoring costs and in turn leading to higher interest rates (Ball et. al, 2015).
Limitations with Quantifying the Cost of Capital Effect Associated with IFRS
B37. In general, the findings on the relationship between IFRS Accounting Standards and the cost of capital cannot be interpreted as causal. Instead, results should typically be interpreted as correlations, for example because their estimates cannot disentangle the impact of IFRS Accounting Standards from other capital market regulations49.
B38. The lack of causal inference in the literature is attributable to:
- Lack of a control group: researchers face difficulties in identifying a "control group”, i.e. a comparable group of companies that did/do not apply IFRS. This is because the adoption of IFRS Accounting Standards typically mandates application for all listed companies in a given jurisdiction at the same time, which makes identifying a control group of companies with publicly available information and similar features virtually impossible.
- Confounding factors: confounding factors make it difficult to isolate the effect of IFRS:50
- at a macro level, this is often due to financial regulation introduced at the same time as IFRS. For example, at the time of adoption in 2005 many jurisdictions embarked on related capital market reforms to support the adoption of IFRS51. Estimates from studies on IFRS adoption in 2005 would likely capture the effect of these concomitant reforms; and
- at a micro level, research designs typically do not isolate the effect of accounting requirements from the underlying economic performance of a company and from the company's application of the given requirements.
- Difficulties in identifying the correct treatment period: the identification of an appropriate treatment period is not always straightforward. It is plausible, for example, that financial markets anticipate changes to accounting standards and may price these changes before a new standard becomes effective. Therefore, the magnitude or even the sign of the
- Research design: some papers utilise research designs that do not deliver causal estimates. For example, some studies rely on simple Ordinary Least Squares (OLS) regression models, which are not suitable for establishing causality.
- Systematic bias towards large companies: most studies focus on the impact of IFRS on the cost of capital for large companies. Smaller companies are often excluded from these analyses since commercial databases usually have much lower coverage of smaller companies which would systematically bias the findings of a study. For example, if larger companies experience a higher marginal benefit from IFRS Accounting Standards the findings may inaccurately overstate the effects of adopting the standards.
Appendix C: Equity and Debt Funding in the UK: Background Information
C1. This section provides background information about equity and debt funding in the UK.
C2. The magnitude of the cost of capital effects predicted through the analysis that follow is largely dependent on the size of funding flows and the outstanding value of capital raised. Therefore, the information provided below is important to contextualise the results.
Reporting Rules
C3. Section 3 in this paper limits the scope of the cost of capital analysis to capital raised through public equity and debt markets. One of the reasons is that IFRS is required for companies with debt/equity listed on public capital markets. This section expands on the reporting rules.
C4. IFRS Reporting requirements for listed equity and debt:
- UK law and the Financial Conduct Authority's Disclosure Guidance and Transparency Rules require the application of UK-adopted international accounting standards in the consolidated financial statements of UK companies whose securities are admitted to trading on a UK-regulated market. This applies to both listed equity and debt[^52].
- UK companies with equity listed on the Alternative Investment Market (AIM) need to produce consolidated financial statement in accordance with UK-adopted international accounting standards even if AIM is not a regulated market as per AIM rules (AIM Rule 19)[^53].
- UK companies with debt listed on the Professional Securities Market (PSM) need to produce consolidated financial statement in accordance with UK-adopted international accounting standards even if PSM is not a regulated market as per FCA UK listing rules (Rule 17.2)[^54].
Public Equity Funding in the UK
C5. As of January 2025, the London Stock Exchange Group (LSEG) featured a total of 1,886 listed entities, of which 1,401 were IFRS reporting entities, including roughly 300 funds and trusts. Of these entities, roughly 550 were listed on the main market and roughly 600 were listed on AIM on AIM. The market capitalisation of these entities was £2.5 trillion.
C6. Companies typically raise funds when they list on an exchange, through mechanisms such as an initial public offering (IPO) or a reverse takeover. However, listed companies can also issue additional equity on public markets, raising funds through secondary offerings. Historical data suggests that equity flows from secondary offerings are greater than equity flows from IPOs[^55].
C7. Capital raised when listing: stock exchange listings are on a negative trend globally, particularly in Europe[^56]. In 2014, the LSE saw 138 new listings (of which 80 in AIM). In 2023, it saw only 23 (of which nine on AIM). Funds raised at inception have declined: in 2014, companies listing for the first time raised £14.5 billion; in 2023, they raised £1 billion. Figure C1 shows the 10-year trend in funds raised through new listings on the LSE:
Figure C1: Capital Raised when Listing on the LSEG A line chart showing capital raised (in £ million) on the LSEG by listing year from 2014 to
- Two lines are shown: "Main market" and "AIM". The "Main market" line starts high (around 14,000 in 2014), drops significantly to a low in 2023 (around 1,000), and is low in 2024. The "AIM" line is consistently lower than the "Main market" line, showing a peak around 4,000 in 2017, and also drops to very low levels by 2023-2024. The overall trend shows a significant decline in capital raised when listing, for both main market and AIM, from 2014 to 2024.
Source: UKEB calculations based on LSEG data.
C8. Capital raised through secondary offerings: secondary offerings are an important means of fundraising for companies listed on the LSEG. Recent years have seen a slowdown of capital raised through secondary offerings, though the trend is less negative than for funds raised at the point of listing. In 2014, companies listed on the LSEG raised £17 billion through secondary offerings. In 2024, they raised £10.7 billion. Figure C2 shows the 10-year trend in funds raised through secondary offerings on the LSE:
Figure C2: Capital Raised through Secondary Offerings on the LSEG A line chart showing capital raised (in £ million) through secondary offerings on the LSEG by year from 2014 to
- Two lines are shown: "Main market" and "AIM". The "Main market" line starts around 17,000 in 2014, peaks around 28,000 in 2020, and then declines to about 10,000 in 2022, rising slightly by 2024. The "AIM" line is consistently much lower, starting around 2,000 in 2014, with some fluctuations, remaining generally below 5,000 throughout the period. The overall trend for secondary offerings shows more fluctuation than new listings, with a peak in 2020 and a general decline since then, but not as sharp as new listings.
Source: UKEB calculations based on LSEG data.
Public Debt Funding in the UK
C9. As of November 2024, there were just over 3,300 active corporate bonds listed on the LSEG by UK incorporated companies, with some issuances dating back to the early 1990s. The value of these bonds was approximately £2 trillion as of 2024 (source: LSEG, Reuters Eikon).
C10. For UK companies, public bond listings are an important source of funding. In 2024 (year-to-date figures up to November), capital raised by UK companies through bond issuances on the LSEG amounted to £107 billion. A negative trend can be observed: in 2014 companies raised over £180 billion[^57]. Figure C3 shows the trend in capital raised through public bond listings by UK incorporated companies:
Figure C3: Capital Raised through Bond Listings on the LSEG A line chart showing capital raised through bond issuances (in £ million) on the LSEG by year from 2014 to
- The y-axis ranges from 80,000.00 to 200,000.00. The line starts high around 180,000 in 2014, shows a general downward trend with some fluctuations, reaching a low around 100,000 in 2021, and rising slightly to around 107,000 in 2024.
Source: UKEB calculations based on Reuters-Eikon data.
Appendix D: Assessment of Direct Costs and Benefits
UKEB Guidelines for the Appraisal of New Accounting Standards
D1. Statutory Instrument 2019/685 (“the SI”) requires that the decisions on adoption of IFRS Accounting Standards are taken after assessing, among other aspects, the costs and benefits resulting from the use of the standard.
D2. The SI does not contain any further guidance on how to conduct a cost and benefit analysis, but the UK government's Better Regulation Framework (BRF) provides a set of guidelines on how to conduct economic impact assessment in UK public bodies [^58].
D3. While the BRF is binding for many public bodies and regulators, the UKEB is not currently included within its scope. Under the terms of the Small Business, Enterprise and Employment Act 2015, the UKEB is not a 'relevant regulator'[^59].
D4. At its September 2021 Board meeting, the UKEB considered and agreed that it should broadly follow the BRF and the principles of the Green Book[^60].
Use of Surveys
D5. For the assessment of significant changes to IFRS Accounting Standards, the UKEB may consider it proportionate to collect evidence on costs and benefits through surveys and/or other primary research (e.g. interviews) [^61]. Surveys may be considered appropriate for the following reasons:
- Lack of secondary data: secondary data to provide evidence on costs and benefits is typically unavailable as the endorsement process is conducted ex-ante. Therefore, the UKEB may need to collect data through primary research.
- The likely effect of IFRS are well established: both the types of costs that accounting standards impose on preparers and the ways through which direct benefits accrue to users are well understood. As a consequence, standardised questionnaires largely composed of closed-ended questions are an appropriate research method.
- Surveys are commonly used for the appraisal of accounting standards: standard setters, financial regulators, consultants, and academics have commonly used surveys in the past to assess costs and benefits of financial reporting regulation.
- Use of standardised questions: by using surveys, the UKEB can streamline the long-term public good assessment of endorsement projects as questionnaires can be standardised. Standardised questionnaires also lead to comparable information between respondents and across endorsement projects and help minimise measurement error. Standardised questionnaires can be amended to reflect the specifics of a given standard.
- Distribution/reach: Surveys can reach multiple stakeholder-types and through a variety of channels (emails, website, QR code, LinkedIn) making them a cost-effective tool for stakeholder engagement.
- Triangulation through qualitative research: survey results can be further investigated using 1-2-1 interviews if the UKEB considers this proportionate.
Direct Costs for Preparers
D6. This section develops a standardised framework to estimate implementation costs using survey evidence[^62].
D7. Direct[^63] implementation costs for preparers are typically estimated by asking finance departments to forecast the costs that they expect to incur, as a result of implementing an accounting standard.
D8. Cost estimates should focus on costs incurred as a direct result of meeting the requirements of the standard, and be expressed in relation to a counterfactual, that is the costs that preparers would have incurred in absence of the standard. The UKEB considered that the counterfactual should be the cost that preparers incurred to prepare the most recent set of financial statements, to be referred to as "baseline cost”. Feedback from preparers suggests that the way baseline cost is calculated may depend on the nature of the standard considered[^64].
D9. Estimates should be monetised where possible and split into one-off and ongoing costs. Evidence on costs should comprise both expected monetary costs (e.g. external audit) and staff reallocation costs (e.g. because of familiarisation, changes to internal processes), the latter representing opportunity costs.
D10. Questions should focus on the following categories of direct implementation costs:
- Familiarisation: understanding the new accounting requirements.
- Accounting system changes: costs associated with changing systems (e.g. accounting software) designed to record the accounting transactions and events of a business and account for them in a way that complies with its policies and procedures.
- Changes to data handling processes and controls: extra costs associated with the transaction data flowing through processes and controls and the recording of these data flows in accounting information systems/software.
- Accounts preparation: extra costs incurred in the preparation of financial statements and disclosure notes, assuming the data needed has been recorded and appropriate adjustments made.
- Communication with third parties: extra costs incurred to change external communications to reflect the new standard.
- Audit costs: audit costs may refer to both internal and external audit.
- Legal costs: legal costs may be internal (which includes an in-house legal team, allocation of existing internal legal staff time, new internal legal staff), or external (which includes fees, an external legal team, amendments to contracts, agreements and covenants that are based on measures subject to change).
D11. Questions should investigate whether preparers anticipate incurring ongoing costs, and for how long these are expected to be incurred before they are subsumed into business as usual.
D12. When drafting questions, the UKEB ensures that preparers are invited to carefully consider the composition and size of implementation costs. This is to limit the risk that the data collected is based on "gut feeling” assessments.
Extracting a Market-Wide Estimate
D13. Survey evidence would cover only a sample of the population. However, this information may be used to extract a market-level estimate.
D14. Such an assessment would provide an indicative range for implementation costs and a starting point for the cost of capital analysis. It should not be interpreted as an accurate forecast of implementation costs.
D15. The following limitations would typically apply:
- Sample size: the UKEB cannot commit enough resources to collect samples representative of the population. Therefore, assessments would generally be based on samples that are not representative of the population.
- Causality: the interpretation of the results would typically not be causal and the regression estimates would have to be interpreted as correlations.
D16. Based on the assumption that implementation costs are likely to be related to company size and other characteristics, the following regression equation may be estimated:
D17. Implementation Costit = βο + β₁Sizeit + β2Other company characteristicsit
D18. Company size is generally expected to positively correlate with implementation costs, as larger companies tend to have larger finance departments and face higher implementation costs. Other regressors to be included on the right-hand side of the equation would depend on a standard's specific requirements and would have to be assessed on a case-by-case basis[^65].
D19. The regression coefficients estimated through the above equation would be used to calculate implementation costs values for companies for which cost information was not collected. A range of costs based on coefficients' confidence intervals may be reported.
D20. In terms of economic interpretation, the intercept, β₀, presents a fixed cost component that would be incurred by any company no matter their features. The respective coefficients, β₁ and β₂, relate to the variable cost component relating different indicators. For example, coefficient β₁ would indicate by how much implementation costs would increase subject to a unit increase in the size indicator.
Direct Benefits for Users
D21. This section develops guidance to estimate direct benefits for users through survey evidence[^66].
D22. Users' perception of the benefits brought by a standard are an important input to assess whether a standard may be expected to bring a cost of capital reduction.
D23. Direct benefits are typically estimated by asking different types of users of financial statements to assess the incremental benefits that they expect from utilising financial statements produced in compliance with a new accounting standard.
D24. The estimates should focus on incremental benefits, that is benefits accrued as a direct result of the requirements of the standard, and that users would not have accrued otherwise. The UKEB considered that the counterfactual should be the benefit that users reaped by analysing financial statements produced in compliance with IFRS accounting standards, prior to the implementation of the new standard.
D25. Previous work suggests that improved accounting standards include the following benefits. Accordingly, questions may focus on:
- more efficient use of time spent analysing financial statements;
- a better assessment of companies' fundamental value;
- more precise forecasts and predictions;
- improved quality of analysis/reports;
- enhanced lending and investment decisions.
Appendix E: Other Contextual Aspects
Adoption of IFRS in 2005: A Point-In-Time Comparison
E1. This Appendix estimates the reduction in cost of capital associated with the adoption of IFRS in the UK, in 2005, and compares the results with the academic literature.
E2. To conduct the analysis (e.g. choice of sample and econometric method), the UKEB referred to the literature reviewed in Appendix B. Within the broader context of the review, this appendix relies more heavily on four studies that present suitable empirical models, samples that cover the UK, and are among the most authoritative and cited on the topic. [^67]
E3. In line with the approach taken by those studies, the following regression model was applied using data from Reuters-Eikon. The sample is comprised of all UK listed entities between 2002 and 2007:
Cost of capitalit = βο + β₁IFRS pre – postit + Controls
In the above equation: the cost of capital is an implied cost of capital measure, calculated using Reuters-Eikon data; and controls represent an entity's leverage, total assets and volatility of stock returns.
E4. The regression model delivered a cost of capital reduction estimate of:[^68]
102Bps ± 81Bps
E5. The UKEB estimate is subject to the same limitations as the results in the underlying literature (see Appendix B).
E6. The estimate was cross-validated with results from the studies mentioned in E2 above, namely:
- Christensen, Lee and Walker (2008) provides cost of capital reduction estimates associated with two different cost of capital measures. [^69] The lower estimate is roughly comparable to the UKEB one. An average of the two delivers a 95% confidence interval estimate of 155Bps ± 45Bps which largely overlaps with the UKEB estimate.
- Christensen, Lee and Walker (2008) also note that the UK estimate is higher than the EU estimate, which the authors credibly attributed to the maturity of its financial market and the strength of its institutions and rule of law. [^70] The UKEB calculated that the UK estimate in that study is higher by a factor of 1.77 (on average).
- An unweighted average of the cross-jurisdiction estimates for mandatory adopters from Li (2010), Daske et al. (2008) and Hail and Leuz (2007) delivered a 95% confidence interval estimate of 35Bps ± 25Bps. Based on the results from Christensen, Lee and Walker (2008) and the cited literature, the cost of capital reduction in the UK was likely higher than the cross-jurisdiction result.
- Multiplying the cross-jurisdiction average by a factor of 1.77, and taking an unweighted average of this estimate and the ones from Christensen, Lee and Walker (2008), delivers a confidence interval of 109Bps ± 45Bps, which was considered to be in line with the estimates obtained.
E7. The results obtained suggest that the introduction of IFRS in the UK may have been associated with a cost of capital reduction of approximately 100 Bps and with the range distributed following a normal distribution around that average.
E8. This range should be considered as an indicative, plausible estimate based on the estimated econometric model and the literature on the topic. The caveats of the econometric analysis are applicable when interpreting the results, particularly the lack of causality and the implementation of other policies, e.g. corporate governance reforms, at the time of adoption of IFRS.
Reference List
- Akgün, A.İ., (2016) Quality of the Financial Reporting within the IFRS: Research on Determining the Attitudes and Evaluations of Financial Information Users. Muhasebe ve Finansman Dergisi, (69), pp.169-188.
- Alderighi, S. & Cleary, S. & Varanasi, P. (2019). Do institutional factors influence cross-border portfolio equity flows? New evidence from emerging markets, Journal of International Money and Finance, Elsevier, vol. 99(C).
- Almaghrabi, K. S., Opong, K., & Tsalavoutas, I. (2021). Compliance with pension-related mandatory disclosures and debt financing. Journal of Business Finance & Accounting, 48(1-2), 148-184.
- Arhinful, R., Mensah, L., Amin, H.I.M. et al. The influence of cost of debt, cost of equity and weighted average cost of capital on dividend policy decision: evidence from non-financial companies listed on the Frankfurt Stock Exchange. Futur Bus J 10, 99 (2024).
- Benos, E., Gurrola Perez, P. and Alderighi, S. (2021) Centralising Bond Trading. Available at SSRN: https://ssrn.com/abstract=4326769
- Beuselinck, C and Joos, P and Khurana, I and Van der Meulen, S (2009), Mandatory IFRS Reporting and Stock Price Informativeness http://dx.doi.org/10.2139/ssrn.1381242
- Botosan, C.A., and Plumlee, M.A. (2005) Assessing Alternative Proxies for the Expected Risk Premium. The Accounting Review, vol. 80, no. 1, 2005, pp. 21–53. JSTOR, http://www.jstor.org/stable/4093160.
- Botosan, C.A., and Plumlee, M.A. (2002). Assessing the Construct Validity of Alternative Proxies for Expected Cost of Equity Capital. http://dx.doi.org/10.2139/ssrn.310181
- Brüggemann, U; Hitz, J; Sellhorn, T (2012) : Intended and unintended consequences of mandatory IFRS adoption: A review of extant evidence and suggestions for future research, SFB 649 Discussion Paper, No. 2012-011, Humboldt University of Berlin, Collaborative Research Center 649 - Economic Risk, Berlin
- Castillo-Merino, D., C. Menendez-Plans, and N. Orgaz-Guerrero (2014), ‘Mandatory IFRS Adoption and the Cost of Equity Capital: Evidence from Spanish Firms', Intangible Capital, Vol. 10, No. 3, pp. 562-83. https://doi.org/10.3926/ic.491
- Chen, F. & Jorgensen, B. & Yoo, Y. (2004) Implied cost of equity capital in earnings-based valuation: international evidence, Accounting and Business Research, Taylor & Francis Journals, vol. 34(4), pages 323-344.
- Chen, T.Y., Chin, C.L., Wang, S. and Yao, C. (2015) The Effects of Financial Reporting on Bank Loan Contracting in Global Markets: Evidence from Mandatory IFRS Adoption. Journal of International Accounting Research, Forthcoming https://ssrn.com/abstract=2675959
- Christensen, H. B, Lee, E., Walker, M. and. (2008), 'Mandating IFRS: Its Impact on the Cost of Equity Capital in Europe', Journal of International Accounting Research, Vol. 9, No. 1, pp. 58-9. https://www.accaglobal.com/content/dam/acca/global/PDF-technical/financial-reporting/rr-105-001.pdf
- Daske, H., Hail, L., Leuz, C. and Verdi, R. (2008), Mandatory IFRS Reporting Around the World: Early Evidence on the Economic Consequences, Journal of Accounting Research, Vol. 46, No. 5, pp. 1085-142. http://dx.doi.org/10.2139/ssrn.1024240
- Daske, H., Hail, L., Leuz, C. and Verdi, R. (2013), Adopting a Label: Heterogeneity in the Economic Consequences Around IAS/IFRS Adoptions https://ssrn.com/abstract=1864771
- Dargenidou, C., McLeay, S. and Raonic, I. (2006), Expected earnings growth and the cost of capital: an analysis of accounting regime change in the European financial market. Abacus, 42: 388-414. https://doi.org/10.1111/j.1467-6281.2006.00207.x
- De George, E.T., Li, X. & Shivakumar, L. (2016). A review of the IFRS adoption literature. Rev Account Stud21, 898-1004 https://doi.org/10.1007/s11142-016-9363-1
- Florou, A. and U. Kosi (2015), 'Does Mandatory IFRS Adoption Facilitate Debt Financing?', Review of Accounting Studies, Vol. 20, No. 4, pp. 1407-56. http://dx.doi.org/10.2139/ssrn.1508324
- Gkougkousi, X. and G. Mertens (2010), Impact of Mandatory IFRS Adoption on the Financial Sector, Working Paper, SSRN: https://ssrn.com/abstract=1651088
- Hail, L. and C. Leuz (2007), Capital Market Effects of Mandatory IFRS Reporting in the EU: Empirical Evidence, Working Paper SSRN: https://ssrn.com/abstract=151167.
- Hail, L. and Leuz, C. and Wysocki, P. (2010), Global Accounting Convergence and the Potential Adoption of IFRS by the U.S. (Part I): Conceptual Underpinnings and Economic Analysis. Accounting Horizons, Vol. 24, No. 3, pp. 355-394, 2010, Available at SSRN: https://ssrn.com/abstract=1674723
-
Horton, J., Serafeim, G. and Serafeim, I., 2013. Does mandatory IFRS adoption improve the information environment?. Contemporary accounting research, 30(1), pp.388-423. https://doi.org/10.1111/j.1911-3846.2012.01159.x
-
Hong, H.A., Hung, M. and Lobo, G.J., (2014) The Impact of Mandatory IFRS Adoption on IPOs in Global Capital Markets. The Accounting Review, Volume 89, Issue 4, 2014, https://ssrn.com/abstract=2388045
- Houqe, M.N., Opare, S., and van Zijl, T. (2021), 'Meta-analysis of the Impact of Adoption of IFRS on Financial Reporting Comparability, Market Liquidity, and Cost of Capital', Abacus, Vol. 57, No. 3, https://doi.org/10.1111/abac.12237
- Houqe, M.N., Monem, R.M., van Zijl, T. (2016). The economic consequences of IFRS adoption: Evidence from New Zealand. Journal of International Accounting, Auditing and Taxation, Volume 27, pp. 40-48.
- ICAEW (2015), The effects of mandatory IFRS adoption in the EU: a review of empirical research.
- Ketterer, S., Dionysiou, D., Eierle, B. & Tsalavoutas, I., (2023) Validating implied cost of capital with realized returns by using alternative measures of cash-flow news, The British Accounting Review, Elsevier, vol. 55(6).
- Kim, J. B., Tsui, J. S. and Yi, C. H. (2011), ‘The Voluntary Adoption of International Financial Reporting Standards and Loan Contracting Around the World', Review of Accounting Studies, Vol. 16, No. 4, pp. 779-811. https://doi.org/10.1007/s11142-011-9148-5
- Lambert, R. & Leuz, C. & Verrecchia, R. (2007) Accounting Information, Disclosure, and the Cost of Capital, Journal of Accounting Research, Wiley Blackwell, vol. 45(2), pages 385-420, May.
- Lang, M., Lins, K.V. and Maffett, M., 2012. Transparency, liquidity, and valuation: International evidence on when transparency matters most. Journal of Accounting Research, 50(3), pp.729-774.
- Lenormand, G. and Touchais, L. (2021), "Does International Financial Reporting Standard 8 improve the firms' information environment?", Journal of Applied Accounting Research, Vol. 22 No. 2, pp. 383-400. https://doi.org/10.1108/JAAR-05-2020-0088
- Leuz, C. and Wysocki, P.D., 2016. The economics of disclosure and financial reporting regulation: Evidence and suggestions for future research. Journal of accounting research, 54(2), pp.525-622.
- Li, S. (2010), 'Does Mandatory Adoption of International Financial Reporting Standards in the European Union Reduce the Cost of Equity Capital?', The Accounting Review, Vol. 85, No. 2, pp. 607-36.
- Madhavan, A., Porter, D., Weaver, D. (2005), Should securities markets be transparent?, Journal of Financial Markets, Volume 8, Issue 3, Pages 265-287, ISSN 1386-4181.
- Mazzi, F., Andre, P., Dionysiou, D. and Tsalavoutas, I. (2017), Compliance with goodwill related mandatory disclosure requirements and the cost of equity capital. Accounting and Business Research, 47(3), 268-312. https://doi.org/10.1080/00014788.2016.1254593
- Meeks, G. and Meeks, J.G.T., 2002. Towards a cost-benefit analysis of accounting regulation. Centre for Business Performance.
- Napier, C.J., Stadler, C, (2020). The real effects of a new accounting standard: the case of IFRS 15 Revenue from Contracts with Customers, Accounting and Business Research, Taylor & Francis Journals, vol. 50(5), pages 474-503.
- Oswald, D. & Simpson, A & Zarowin, P (2022) Capitalization vs. expensing and the behavior of R&D expenditures, Review of Accounting Studies, Springer, vol. 27(4), pages 1199-1232, December.
- Palea, V. (2007), 'The Effects of the IAS/IFRS Adoption in the European Union on the Financial Industry', The European Union Review, Vol. 12, Nos 1-2, pp. 1-48.Christensen
- Pathiranage, N.P. and Jubb, C.A., 2018. Does IFRS make analysts more efficient in using fundamental information included in financial statements?. Journal of contemporary accounting & economics, 14(3), pp.373-385.
- Paugam, L. and O. Ramond (2015), 'Effect of Impairment-testing Disclosures on the Cost of Equity Capital', Journal of Business Finance & Accounting, Vol. 42, Nos 5-6, pp. 583-618.
- Pavlopoulos, A., & Iatridis, G. E. (2023). Integrated Reporting and IFRS 3: an empirical study to Cost of Equity through Firm Risk and Investor Protection. International Conference on Business and Economics - Hellenic Open University, 1(1). https://doi.org/10.12681/icbe-hou.5313
- Persakis, A. and G. E. Iatridis (2017), The Joint Effect of Investor Protection, IFRS and Earnings Quality on the Cost of Capital: An International Study, Journal of International Financial Market, Institutions and Money, Vol. 46, pp. 1-29. https://doi.org/10.1016/j.intfin.2016.10.001
- Saleh, A., Aboud, A., Eliwa, Y. (2022) IFRS 8 and the cost of capital in Europe. International Journal of Finance & Economics Vol. 28, Issue 3 p. 3198-3231. https://doi.org/10.1002/ijfe.2590
- Schipper, K., 2010. How can we measure the costs and benefits of changes in financial reporting standards?. Accounting and Business Research, 40(3), pp.309-327.
Contact Us
UK Endorsement Board 13th Floor
| 1 Harbour Exchange | Harbour Exchange Square | London | E14 9GE www.endorsement-board.uk
Footnotes
-
Under The Companies Act 2006, all UK companies are required to keep adequate accounting records and to file their accounts at Companies House where they are made publicly available. This is one of the 'costs' of the benefits of limited liability. The group accounts of a parent company whose securities are, on its balance sheet date, admitted to trading on a UK regulated market must be prepared in accordance with UK-adopted international accounting standards (approximately, 1,400 entities). Other entities may choose to prepare their accounts in accordance with UK-adopted international accounting standards on a voluntary basis, and approximately 14,000 do so each year. See Appendix C for a more detailed analysis. ↩
-
Some entities may want to disclose information to signal their strong fundamentals. ↩
-
Competition is understood both as downstream, i.e. in the provision of products and services, and upstream, i.e. in their relationship with suppliers. ↩
-
There is theoretical and empirical evidence establishing an average, market-wide relationship between the adoption of IFRS accounting standards and a reduction in the cost of capital. This is discussed in greater detail in Appendix B. ↩
-
A change in stock liquidity does not directly influence a company's operating costs or financing structure while a change in the cost of capital influences financing decisions and investments towards future projects. ↩
-
For some preparers, more transparent accounting may unveil information that makes them look less favourable to an equity investor or lender, thus causing their cost of capital to rise. Moreover, some industries or companies may see their financial performance/position hardly altered by a new accounting standard and may therefore experience no cost of capital effects at all. ↩
-
Mazzi et al., 2017; Almaghrabi et al., 2021 ↩
-
The evidence on the topic is relatively scarce, however one academic study focuses on whether effects are transitory or permanent: Dargenidou, Mcleay & Raonic (2006). ↩
-
While the difference seems obvious, as noted in the IASB's Exposure Draft "Financial Instruments with Characteristics of Equity" (FICE) (2023) "financial innovation, market forces and changes to financial sector regulations have resulted in a growing number of complex financial instruments with both financial liability and equity characteristics". This paper ignores funding through such instruments for the sake of simplicity. ↩
-
The chosen combination of equity and debt capital is typically referred to as the company's capital structure. For simplicity, this framework does not consider how changes in the cost of capital alter the capital structure of companies or how companies prioritise funding sources. ↩
-
Capital market effects may accrue through private markets, such as the market for bilateral loans or private equity. These are not included because of lack of market data and for tractability. The analysis could be expanded in the future to capture other capital markets. ↩
-
Other capital market effects may deliver indirect benefits, such as a reduction of volatility, an increase in liquidity and a reduction in bid/ask spreads. These are not included for tractability. The analysis could be expanded in the future to capture other capital market effects. ↩
-
It is acknowledged that some of these effects may be correlated, for example because a reduction in the cost of capital may exacerbate changes in the market value of securities. This correlation is acknowledged but not further developed to keep the model simple. ↩
-
In the Green Book the counterfactual is defined as the continuation of current arrangements, as if the proposal under consideration were not to be implemented. Therefore, business as usual means that the counterfactual may change over time, because ongoing arrangements may evolve or follow trends, which in principle should be considered over the appraisal period. ↩
-
This report discusses the issuance of public equity only. The cost of issuing private equity is not considered in this analysis. The reason is threefold: most jurisdiction mandate companies that list public equity to report in accordance with IFRS. In addition, private equity capital is typically not exchange-traded and data on private equity deals is by and large not available. Finally, private equity investors possess private information about companies and would not solely rely on financial reporting for their decision-making. Therefore, assessing the cost of private equity capital was deemed to be an exercise beyond the scope of this paper. ↩
-
This is predicted by the bird-in-hand theory – see Arhinful, R., Mensah, L., Amin, H.I.M. et al. (2024). ↩↩
-
It must be acknowledged that research has also found that higher transparency may be associated with lower liquidity, due to better informed investors benefitting from a degree of opacity – see for example Madhavan, Porter and Weaver (2005). ↩↩
-
This common practice aims to ensure that the interests of agents are principals are aligned. ↩
-
A positive effect on stock prices is assumed, however the considerations outlined in the main text apply, in reverse, in case of a negative effect on stock prices. ↩
-
This is the method used in the IFRS 18 Draft Endorsement Criteria Assessment (DECA)). ↩
-
The IFRS 18 Draft Endorsement Criteria Assessment reports a simple percentage increase in market capitalisation as opposed to the results of the GGM model. This leads to results that are of a different order of magnitude. As Approach B expresses the effect of the adoption of a standard in terms of cost of capital reductions, for comparability Approach B will be utilised in future endorsement projects. ↩
-
This conjecture relies on the assumption that proceeds from equity issuances are not used to deleverage ↩
-
A dynamic counterfactual may be set, e.g. a varying cost of equity. However, a static counterfactual was set in order to avoid adding assumptions to the calculation, and because it is standard practice to use a static interest rate when performing present value calculations. ↩
-
The Implied Cost of Capital (ICC) is an umbrella term which refers to a class of methods used to calculate the cost of equity by using analysts' forecasts. The main premise underpinning ICC techniques is that analysts' forecasts of companies future cashflows reveal an implied discount rate (i.e. cost of equity), which can be calculated using the current price of the security. In other words, the cost of equity is inferred as the discount rate which would equate analysts forecasts of future earnings to the current price of a security. Analysts' consensus forecasts are therefore used as a proxy for companies' future earnings. ↩
-
The CAPM is commonly used to calculate cost of capital, for example in price regulation. This report does not aim to undermine the validity of the usage of CAPM. The authors believe that CAPM and ICC simply convey different information, and the latter is better suited to the objectives of the approach. ↩
-
The market-wide GMM framework derived above to assess cost of capital reduction at a market level is based on the same underlying theory but the application of the earnings growth model in this paragraph is fundamentally different as it is an entity-level assessment based on microeconomic data. ↩
-
See Botosan, Plumlee (2002), Chen et. al (2004) and Ketterer et al. (2023). ↩
-
The average is weighted by number of observations for each technique. A two-tailed 95% confidence interval was calculated for the baseline cost of capital (percentages): 11.23 ± 0.36. As a robustness check, the analysis was conducted using the lower and upper bounds of the confidence interval as baseline cost of capital. The results were hardly affected. ↩
-
This paper discusses the issuance of public debt only. The cost of issuing private debt, either through bilateral lending or bonds private placements, is not considered in this analysis. The reasons are comparable to the ones discussed for equity. ↩
-
See, Benos, Gurrola-Perez and Alderighi (2022) for a contribution on the topic. ↩
-
This is the method used in the IFRS 18 Draft Endorsement Criteria Assessment (DECA)). As Approach B expresses the effect of the adoption of a standard in terms of cost of capital reductions, for comparability Approach B will be utilised in future endorsement projects. ↩
-
In addition, an appreciation of bonds leads to a reduction in yields, that is in cost of capital for issuers. While the contractual terms of already issued bonds would not change as a result, this would accrue as a benefit for future issuances of capital. ↩
-
In addition, an appreciation of bonds leads to a reduction in yields, that is in cost of capital for issuers. While the contractual terms of already issued bonds would not change as a result, this would accrue as a benefit for future issuances of capital. ↩
-
A dynamic counterfactual may be set, e.g. a varying cost of debt. However, a static counterfactual was set in order to avoid adding assumptions to the calculation, and because it is standard practice to use a static interest rate when performing net present value calculations. ↩
-
Source: Reuters-Eikon ↩
-
A two-tailed 95% confidence interval was calculated for the baseline cost of capital (percentages): 5.03 ± 0.08. As a robustness check, the analysis was conducted using the lower and upper bounds of the confidence interval as baseline cost of capital. The results were hardly affected. ↩
-
Survey evidence collected by the UKEB is typically not based on representative samples because of resource constraints. It is therefore indicative of stakeholders' sentiment but not statistically representative. ↩
-
Real-economy indicators were not assessed as the transmission mechanisms between the real economy and capital markets are not straightforward. On the transmission mechanism between monetary policy, capital markets and the real economy, see this European Central Bank infographic. On the relation between monetary policy, capital markets and the real economy, see Caballero and Simsek (2024). ↩
-
This approach takes a capital markets approach to the topic, however the effects of accounting may be interpreted through an agency theory lens. When there is a separation between ownership and management (diluted shareholding), financial reporting regulation reduces agency issues (moral hazard and adverse selection) by aligning the interests of principals and agents. Shareholders and other capital providers, by accessing the information contained in financial reporting, are able to assess the company's financial performance and position, thus holding management accountable for their decisions. As a result, shareholders demand lower returns to hold the company. Preparers in turn may face a reduction in their signalling costs and a reduced pressure to distribute dividends (Meeks and Meeks, 2002). The agency theory/management stewardship angle are not further developed in this approach and effects associated with improved stewardship (ability of investors to hold management to account) approach are not quantified. ↩
-
See De George, Li and Shivakumar (2016). ↩
-
See Hail, Leuz and Wisocky (2010); Leuz and Wisocky (2016); Lambert, Leuz and Verrecchia (2007). ↩
-
See Florou & Kosi, 2015; Kim, Tsui and Yi, 2011 ↩
-
The literature also shows that IFRS is associated with other capital market effects. For example the literature shows that IFRS is associated with an enhanced information content of trades: see for example, Beusenlick et. al (2009), who assess the informativeness of stock prices following the adoption of IFRS in 2005. Oswald, Simpson and Zarowin, 2020, focusing on the price informativeness on R&D reporting requirements under IFRS. IFRS is also associated with lower IPO under pricing, as found in Hong et al. (2014). ↩
-
A review of other capital market outcomes (e.g. stock liquidity, in the form of bid/ask spreads and trading volumes; market-level liquidity; price volatility; price informativeness) is beyond the scope of this report. It is also noted that the academic literature provides evidence on the capital market effects associated with US and other national GAAPs, as well as non-financial reporting (e.g. first half of the annual report, sustainability reporting). These topics are also beyond the scope of this report. ↩
-
The UKEB did conduct not a systematic review such as the one conducted by Opare, Hoque and Van Zijl (2021) as it was not considered proportionate. Narrative reviews like the one in this paper (see for example De George, Li and Shivakumar, 2016 and ICAEW, 2015) are considered to be more subjective in the selection of the studies and in their summary of the effects than systematic reviews but are far less resource-intensive. ↩
-
This is consistent with other research, for example Alderighi, Cleary and Varanasi (2019) find that cross-border equity inflows are positively correlated with the adoption of IFRS but only in conjunction with lack of capital controls and strict corporate governance requirements. ↩
-
Disclosure scores are typically hand-collected and calculated as the number of disclosures that an entity reports divided by the total number of disclosures required by a given standard. A criticism of this approach is that these scores merely capture the quantity of disclosures that companies make rather than their quality. This is problematic from an identification point of view, as disclosure quality and cost of capital may be both correlated with omitted variables. In addition, they are sometimes considered subjective as highly dependent on the researcher's interpretation/criteria. ↩
-
Some studies focus on economic effects beyond capital markets, such as Stadler and Napier (2020) and Osma, Gomez-Conde and Mora (2023), both focusing on the impact of IFRS 15. ↩
-
The considerations in this section are mostly drawn from two literature review papers, Brüggemann, Hitz and Sellhorn (2012) and Leuz & Wysocki (2016) ↩
-
This is a different problem from the absence of a control group, as even if a control group was present, confounding factors may affect the treatment effect. ↩
-
For example, around IFRS adoption, the EU enacted legislation such as the Market Abuse Directive (Directive 2003/6/EC) and the Transparency Directive (Directive 2004/109/EC). ↩