An_Approach_to_Estimating_Capital_Market_Effects_Summary
This document provides a high-level summary of a paper published by the UK Endorsement Board (UKEB) in September 2025. The paper set out an approach to assessing cost of capital reductions, associated with the adoption of new IFRS accounting standards, that would allow preparers to recover implementation costs.
See the paper: Endorsement of Standards: An Approach to Estimating Capital Market Effects
The UK Endorsement Board
1The UKEB is the UK's National Standard Setter, responsible for the endorsement and adoption of IFRS Accounting Standards for use in the UK. The UKEB also leads the UK's engagement with the IFRS Foundation on the development of new international accounting standards, amendments and interpretations.
Why has the UKEB Developed an Approach to Estimating Capital Market Effects?
2The adoption of new accounting standards typically imposes a direct cost on preparers, largely for the direct benefit of users. This is the focus of most economic assessments.
3However, such assessments ignore indirect economic effects such as better financial reporting leading to improved capital allocation, which in turn is associated with a market-wide reduction in the cost of capital.
4The approach outlined by the UKEB compares the potential reduction in the cost of public equity and debt associated with a new IFRS accounting standard with the estimated direct costs on preparers.
5The Board intends to use this approach, which is not standard-specific, on a case-by-case basis to supplement the evidence base considered for the endorsement of IFRS accounting standards for use in the UK.
Economic Rationale
6In addition to direct costs on preparers and direct benefits to users, the UKEB has identified the following economic effects associated with the adoption of IFRS Accounting Standards:
- First-order indirect effects: capital market effects triggered by the enhanced interaction between users and capital markets, such as reductions in cost of capital and improved liquidity.
- Other indirect effects: microeconomic, industry and economy-wide effects.
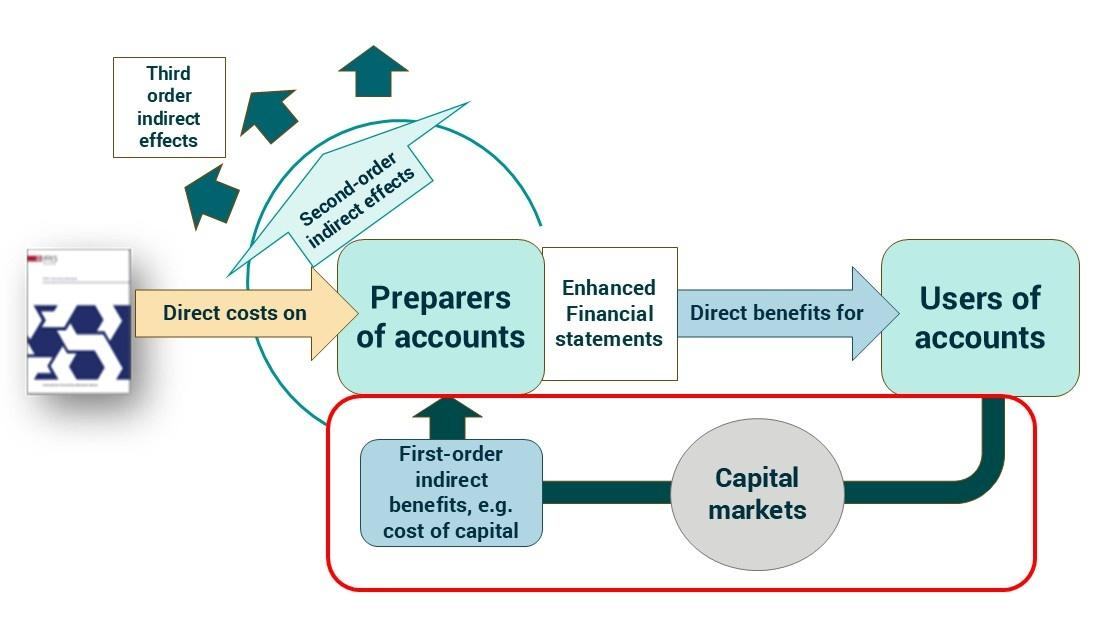
7The approach will consider scenarios in which indirect monetary benefits delivered through capital markets would allow preparers to recover their implementation costs in the long run.
Structure of the Approach
8Entities typically use equity and debt as external funding sources. This approach quantifies the potential monetary benefits, through any of the following four market-level effects, required to offset preparers' estimated implementation costs for a new accounting standard:
| Equity | Debt |
|---|---|
| 1 Increase in market capitalisation | 3 Increase in the outstanding value of corporate bonds |
| Stock - Securities already issued | |
| 2 Decrease in the cost of equity leading to more projects funded through public equity | 4 Decrease in the cost of debt leading to more projects funded through publicly traded corporate bonds |
| Flow - Securities to be issued in the future |
9The following sections expand on the four effects described in the table. All the effects are considered market-wide. The calculations reported are based on UK market data, but could be performed on other markets. BPs stands for Basis Points. Factors such as concurrent market policies are not considered.
Increase in Market Capitalisation
10Introduction of a new accounting standard may affect share prices. Enhanced transparency and comparability increase demand from investors, leading to higher liquidity, lower cost of capital, and a subsequent increase in companies' valuations, resulting in higher market capitalisation.
11The Gordon Growth Model (GGM) can be used to understand how changes in cost of equity affect stock prices. Under four different implementation costs scenarios, a market-wide application of the GGM leads to the following results:
Chart showing Cost of Capital Decrease (Basis Points) for different Direct Implementation Costs (Scenarios)
The chart displays four bars, corresponding to Direct Implementation Costs (Scenarios) of £50,000,000, £100,000,000, £200,000,000, and £500,000,000. The associated Cost of Capital Decrease (Basis Points) are: * £50,000,000: 0.008 Bps * £100,000,000: 0.016 Bps * £200,000,000: 0.032 Bps * £500,000,000: 0.08 Bps
Source: UKEB calculations based on Reuters-Eikon data.
12To obtain an increase in market capitalisation of, say, £200 million, cost of equity would need to decrease by 0.032 Bps (or 0.00032%).
Impact on Future Equity Issuances
13A reduction in the cost of equity would increase the present value of future equity flows, discounted at the current cost of equity.
14The approach is to estimate the market-wide cost of equity reduction that would lead to an increase in the present value of future equity flows equivalent to implementation costs for preparers.
15Under four different implementation costs scenarios, the approach leads to the following results:
Chart showing Cost of Equity Decrease (BPs) for different Direct Implementation Costs (Scenarios)
The chart displays four bars, corresponding to Direct Implementation Costs (Scenarios) of £50,000,000, £100,000,000, £200,000,000, and £500,000,000. The associated Cost of Equity Decrease (BPs) are: * £50,000,000: 1.1 Bps * £100,000,000: 2.2 Bps * £200,000,000: 4.4 Bps * £500,000,000: 10.9 Bps
Source: UKEB calculations based on LSEG and Reuters-Eikon data.
16To obtain an increase in the PV of equity flows equal to, say, £200 million, market-wide cost of equity would have to decrease by 4.4 Bps (or 0.044%).
Increase in Market Value of Corporate Bonds
17The prices of individual bonds traded on public markets fluctuate based on demand and supply, as well as economic factors (e.g. companies' credit risk, the base interest rate).
18More transparent and comparable accounting would lead to an appreciation of traded bonds, on average, and to a reduction of yields (i.e. cost of debt).
19The approach estimates the yield decrease needed for an increase in the total market value of bonds at a given point in time to be equivalent to implementation costs.
20Under four different implementation costs scenarios, an application leads to the following results:
Chart showing CC Reduction (BPs) for different Direct Implementation Costs (Scenarios)
The chart displays four bars, corresponding to Direct Implementation Costs (Scenarios) of £50,000,000, £100,000,000, £200,000,000, and £500,000,000. The associated CC Reduction (BPs) are: * £50,000,000: 0.3 Bps * £100,000,000: 0.6 Bps * £200,000,000: 1.2 Bps * £500,000,000: 3.0 Bps
Source: UKEB calculations based on LSEG and Reuters-Eikon data.
21To obtain an increase in the outstanding value of bonds equal to, say, £200 million, cost of debt would need to decrease by 1.2 Bps (or 0.012%).
Impact on Future Corporate Bonds Issuances
22A reduction in the cost of debt would increase the present value of future funding through fixed income, discounted at the current cost of debt.
23The approach is to estimate the reduction in the market-wide cost of debt that would lead to an increase in the present value of future debt flows equivalent to implementation costs for preparers.
24Under four different implementation costs scenarios, the approach leads to the following results.
Chart showing Cost of Debt Decrease (BPs) for different Direct Implementation Costs (Scenarios)
The chart displays four bars, corresponding to Direct Implementation Costs (Scenarios) of £50,000,000, £100,000,000, £200,000,000, and £500,000,000. The associated Cost of Debt Decrease (BPs) are: * £50,000,000: 0.25 Bps * £100,000,000: 0.5 Bps * £200,000,000: 1.0 Bps * £500,000,000: 2.5 Bps
Source: UKEB calculations based on Reuters-Eikon data.
25To obtain an increase in the present value of bonds issuances equal to, say, £200 million, cost of debt would need to decrease by 1 Bp (or 0.01%).
Limitations
26The following limitations are acknowledged:
- The results are not predictions: the approach is applied ex-ante and is not suitable for making predictions of future price trends or cost of capital reductions.
- The effects are market-wide: the approach is used to obtain market-level assessments.
- Preparers will not directly offset their costs: the approach quantifies monetary benefits associated with reductions in cost of capital that would allow preparers to indirectly recover their implementation costs.
- Other capital market effects are not quantified.
- Other wider economic effects are not quantified.
27When used, the approach outlined in this document would represent only part of the evidence considered by the Board to assess whether a standard is conducive to the long-term public good in the UK.
Conclusions and Next Steps
28The approach was used for the first time to produce relevant evidence for the endorsement of IFRS 18 (see [Draft] Endorsement Criteria Assessment, paragraphs 4.81 - 4.97). However, these estimates have not been back-tested yet.
29The UKEB is seeking feedback on the approach to:
- Identify other potential improvements to the approach.
- Expand the approach to consider other capital market effects.
- Assess its break-even estimates through ex-post assessments based on market data.
30The UKEB welcomes comments from all relevant stakeholders: preparers, users, auditors but most importantly national and international standard setters who may see the value of implementing a similar methodology as part of their own assessments. The approach is not standard-specific and it would be important to understand whether it could be applied in other jurisdictions.
31If you have comments don't hesitate to contact the UKEB at [email protected]
The UKEB must consider the UK's long-term public good in its decision-making and is committed to making its assessments of this appropriately robust.
This innovative work on the cost of capital will support our analysis of the benefits of new standards and the extent to which they deliver on the long-term public good. Deploying this model will provide important insights as the Board reaches its endorsement decisions.
We are keen to further improve our approach to the evidence the UKEB deploys in reaching its decisions, and we welcome feedback and engagement from our stakeholders on the cost of capital analysis, which will help us make such improvements over time.
UKEB Chair, Paul Lee
Contact Us
UK Endorsement Board 1 Harbour Exchange | London | E14 9GE www.endorsement-board.uk
Stay up to date:
Subscribe to stay up to date on UKEB news and events
The UKEB does not accept any liability to any party for any loss, damage or costs howsoever arising, whether directly or indirectly, whether in contract, tort or otherwise from an action or decision taken (or not taken) as a result of any person relying on or otherwise using this document or arising from any omission from it.
© (2025) All Rights Reserved