7 Update on Intangibles Research
Executive Summary
Project Stage
| Research / Pipeline | Discussion paper | Redeliberation | Exposure Draft | Redeliberation | Final standard | Post Implementation Review | |
|---|---|---|---|---|---|---|---|
| IASB | Research / Influencing | Monitoring | Influencing | Monitoring | Endorsement | Influencing | |
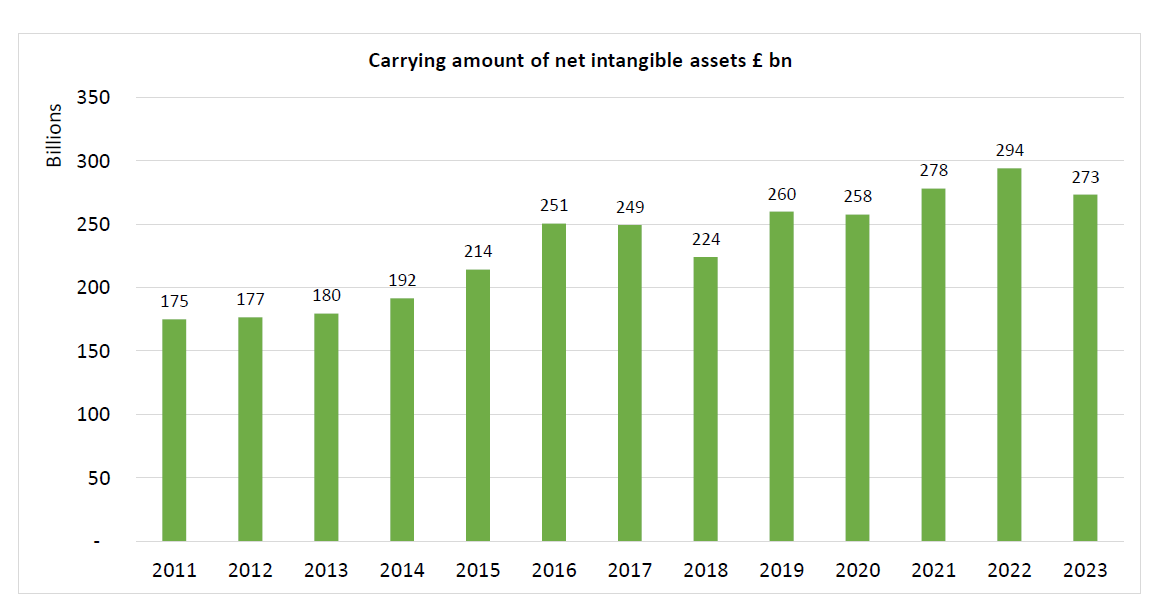
| UKEB | Research / Influencing | Research / Influencing | Monitoring | Influencing | Monitoring | Endorsement | Influencing |
Project Scope
| Project Scope | Significant |
|---|---|
Purpose of the paper
This paper provides the Board with an update to some of the key metrics published in the UKEB report "Accounting for Intangibles: A Quantitative Analysis of UK Financial Reports" (the report) in May 2024. The updated information will be incorporated into future UKEB presentations and communications in relation to intangibles.
Summary of the Issue
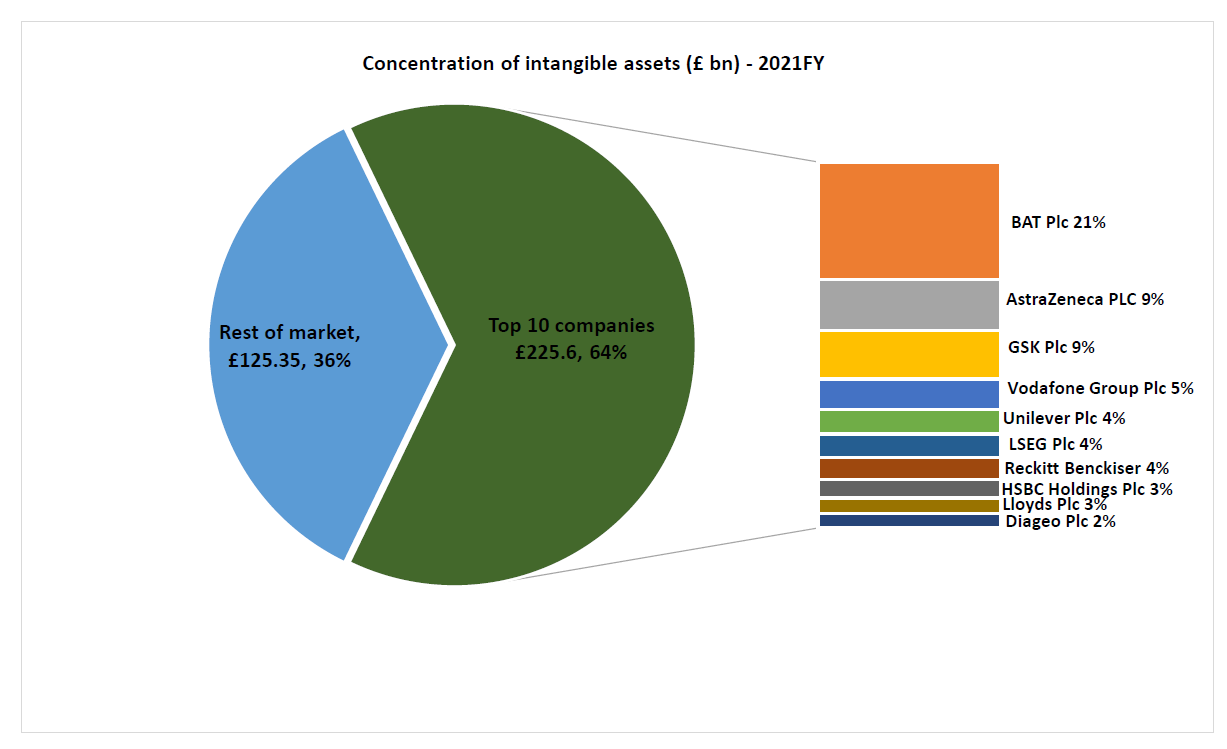
This paper makes no recommendations. Key findings include:
- Recognised intangibles continued growing in 2022, however there was a significant decrease in 2023.
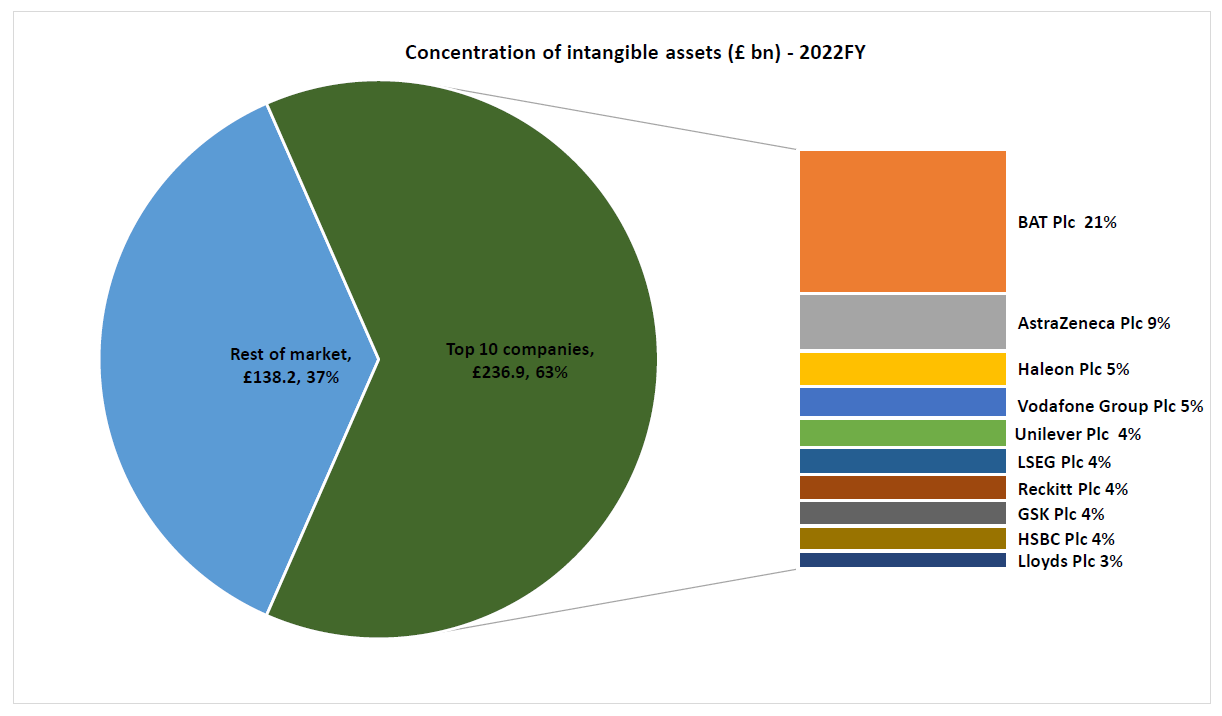
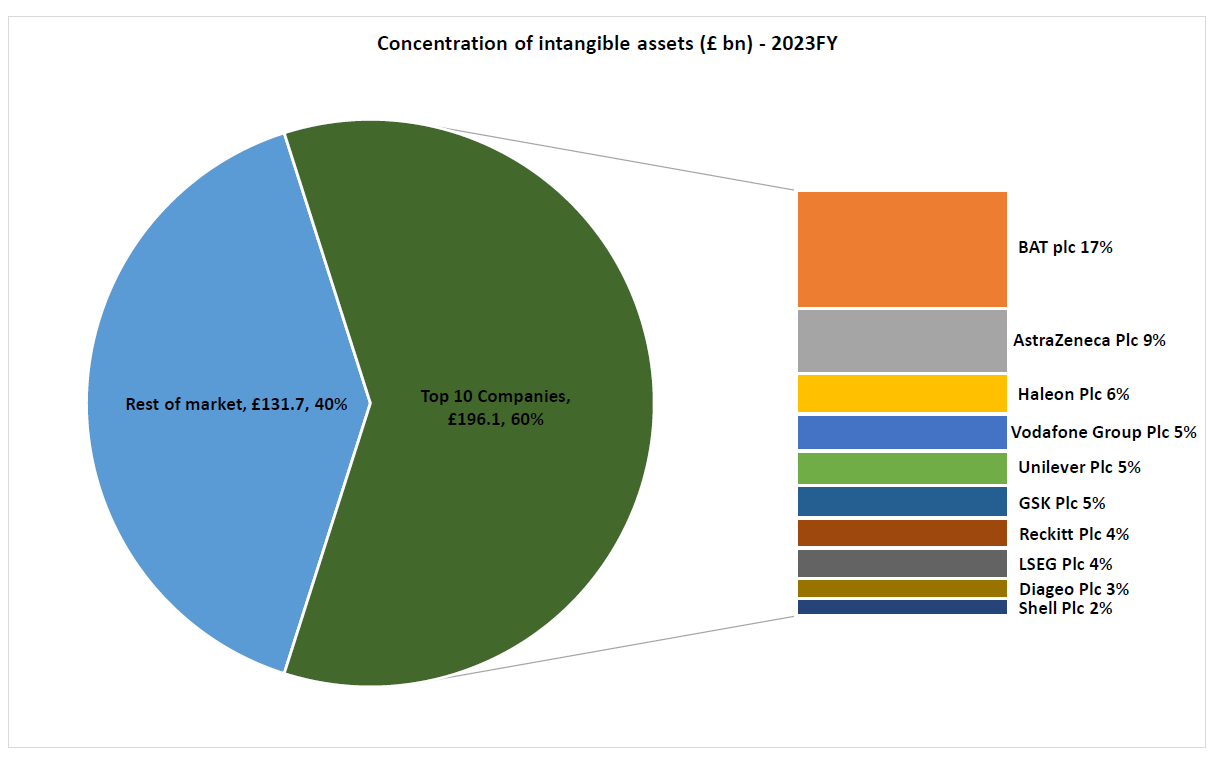
- This decrease was primarily the result of impairments to intangibles by a single company, British American Tobacco.
- In 2022 a newly formed company, Haleon, had the third largest holding of recognised intangibles by a UK company. However, intangible assets were marginally less concentrated among the top ten UK companies.
Decisions for the Board
- Does the Board have any comments on the updated information from the report?
Background
Intangible Assets
In April 2024 the IASB announced that it was commencing its comprehensive review of accounting requirements for intangibles. The project will assess whether the requirements of IAS 38 Intangible Assets remain relevant and continue to fairly reflect current business models or whether the IASB should improve the requirements.
In response, the UK Endorsement Board has undertaken a comprehensive research project. It considers how the accounting for, and reporting of, Intangible Assets could be improved to provide investors with more useful general purpose financial statements to assist them to make better informed decisions.
The project has:
- Explored UK stakeholders' views on the accounting for intangibles under International Accounting Standards1.
- Reviewed the nature and extent of current reporting practices for intangibles among listed UK companies using IFRS standards2.
- Engaged with investors to better understand their perspectives on the current and future reporting of intangibles in the financial statements3.
The IASB is currently discussing the feedback it has heard, and other evidence gathered, in the initial phase of the Intangible Assets project. At a future meeting the IASB will be asked to make a decision on the direction of the project. (See also this month's IASB update paper).
1In May 2024, the UKEB published a report titled "Accounting for Intangibles – A Quantitative Analysis of UK Financial Reports" which provided an overview of the nature and extent of current reporting of intangibles by UK listed companies using IFRS Accounting Standards. The report analysed how these companies account for intangibles (including capitalisation and expensing) and the associated disclosures.
Updated information
2This paper provides the Board with an update to some of the key metrics since the publication of the report in May 2024. This update focuses on the following data for 2022 and 2023:
- Carrying amounts of intangibles on UK listed companies;
- Carrying amount of intangible assets as a percentage of total assets;
- Concentration across the LSE; and
- Distribution of the carrying amounts of intangible assets by industry.
Recognised intangibles in UK listed companies' reports
3Intangible assets4 showed a generally consistent upward trend growing at an average rate of 8% per year between 2011 and 2021.
4The total value of intangible assets reached £375 billion in 2022 for all UK listed companies, representing an increase of £24 Billion (7%) from the previous year. This growth was consistent with what we had observed in previous years.
5A significant portion of the growth in 2022 is attributable to a £9 billion exchange rate gain recognised by British American Tobacco (BAT). Other drivers included the increase in intangible assets held by large-cap entities, such as National Grid and Rentokil Initial, of about £2 billion and £1 billion respectively.
6In 2023, the value of intangible assets fell to £328 billion, down £47 Billion (12%) from 2022. This was mainly due to a £27.6 billion impairment charge to some of BAT's US trademarks. These results are presented in the chart below.
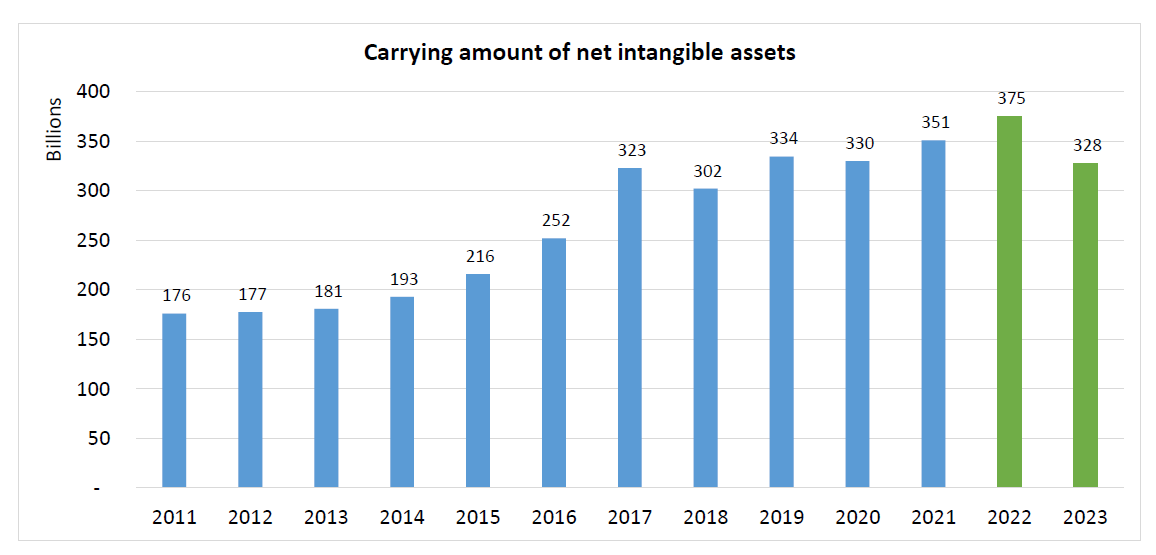
7On average, the growth rate in the value of intangible assets per year was approximately 5.8% over the period from 2011 to 2023. This still exceeds inflation which grew at an average of 2.8% per year over the same period.
8Overall, while the carrying amount of net intangible assets declined in 2023, this was mainly attributable to significant impairments and disposals that occurred between 2022 and 2023. It does not indicate that companies are becoming less acquisitive and therefore recognising fewer intangible assets.
Carrying amount of intangible assets as a percentage of total assets
9The relative share of intangible assets as a percentage of total assets increased from 1.67% in 2011 to 3.03% in 2021. In 2022 this percentage increased to 3.63% and subsequently declined to 3.24% in 2023.
10This upward trend in intangible assets as a percentage of total assets between 2021 and 2022 is again primarily attributable to the changes in BAT and Haleon, as discussed in paragraph 5 above, and is consistent with the upward growth trend in the carrying amount of net intangible assets in those two years.
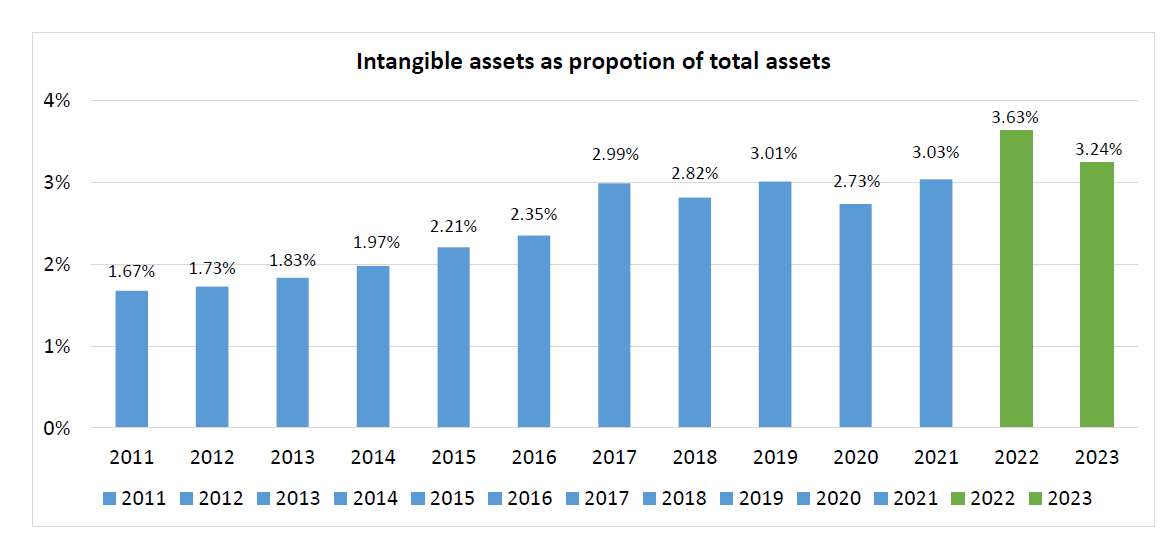
11Overall, the results of the 2022 financial year show continued growth in the share of intangible assets as a percentage of total assets. This is consistent with the findings of our previous report.
12However, between 2022 and 2023, there was a 0.39 percentage point decrease in the share of intangible assets as a proportion of total assets. This was mainly driven by a decrease in the carrying amount of intangible assets held by entities such as BAT, AstraZeneca and London Stock Exchange Group (LSEG). Despite this, the proportion of intangible assets is still higher than it was between 2011 to 2021.
Concentration across the LSE
13In 2021, ten companies on the LSE held almost two thirds of the total intangible assets balance on the LSE. These ten companies accounted for only 37% of the total assets of all listed companies, which indicated that the size of intangible assets in their balance sheet was not simply due to them holding a disproportionately large amount of total assets.
14The concentration of intangible assets among these few large mainly resulted from sizeable mergers and acquisitions, which included the recognition of purchased intangible assets on the acquirers' balance sheets.
15Intangible assets have become slightly less concentrated among the ten largest companies as reflected by the downward trend to 2023, although these bigger companies continue to dominate the market. The downward trend can be attributed to the impairments and disposals made by some of the top 10 companies including BAT and AstraZeneca.
- In 2021, 10 companies held approximately 64% of intangible assets.
- In 2022, 10 companies held approximately 63% of intangible assets.
- In 2023, 10 companies held approximately 60% of intangible assets.
16In the 2022 financial year Diageo left the top ten companies with the entry of a new company, Haleon. Diageo subsequently re-entered the top ten in 2023 alongside Shell. HSBC Holdings and Lloyds Bank Group both left the top ten in 2023.
17Haleon was established on 18 July 2022 as a corporate spin-off from GSK, taking its consumer healthcare brands. It's intangible assets comprise goodwill, indefinite life brands, amortised brands, licences and patents, computer software and assets under construction. Of these intangible assets, indefinite life brands were the highest balance at £18 billion followed by goodwill of £8.3 billion and the remaining intangible assets totalling £465 million. The non-goodwill intangible assets recognised were matched by the derecognition of intangibles by GSK (hence it's decrease in concentration).
Distribution of the carrying amounts of intangible assets by industry
18At the end of 2021, the consumer staples and healthcare industries held the highest carrying amount of intangible assets. The consumer staples industry held intangible assets totalling 34% of the population's total, with a book value of £118 billion. The healthcare industry held intangible assets totalling 19% of the population's total, with a carrying amount of £66 billion.
19By contrast, the technology, basic materials, and utility industries were among the industries with the lowest absolute carrying amount of intangible assets in 2021. These industries accounted for £8 billion, £6 billion and £4 billion of the carrying amount of the total intangible assets respectively and collectively held 5% of the total carrying amount of intangible assets.
20In the 2023 financial year, the consumer staples, healthcare and financials industries remain the highest-ranking by value of intangible assets. The utilities, technology and real estate sectors continue to account for the smallest proportions of the share of intangible assets. In 2023, these sectors collectively held approximately 2% of intangible assets. This trend is consistent with the findings of the 2011 - 2021 period.
Distribution of intangible assets by industry (£ 'Bn) 2021 - 2023
This stacked bar chart illustrates the distribution of intangible assets (in billions of pounds) across various industries for the years 2021, 2022, and 2023. Each bar represents a year, with segments showing the proportion and value held by different industries.
Legend: * Consumer Staples * Health Care * Financials * Consumer Discretionary * Industrials * Energy * Telecommunications * Basic Materials * Utilities * Real Estate
The impact of British American Tobacco
21Following a 2016 business combination transaction, BAT held between 16% - 25% of all recognised intangible assets in each year from 2017 to 2023.
22Because BAT has such an outsized impact on the data, the analysis was rerun excluding them. The exclusion of BAT from the dataset results in the growth rate in intangible assets being more stable compared to the more volatile trend when BAT is included in the dataset.
23In the 2023 financial year, after excluding BAT from the dataset:
- the total carrying amount of intangible assets held by listed entities was roughly £273 billion.
- the level of concentration of intangible assets among large companies is less significant than with the inclusion of BAT. At the end of 2023, the 10 largest companies by value of intangible assets held approximately 55% of intangible assets compared to approximately 60% when BAT is included.
- intangible assets made up 2.73% of total assets held by listed entities compared to 3.24% when BAT is included in the dataset.
- the consumer staples industry lost its position as the highest-ranking sector by value of intangible assets to the health care sector. The other industries remain unchanged from when BAT is included in the analysis.
24Overall, while BAT continues to be among the largest companies with the highest carrying amounts of intangible assets within and across the top 10 sectors, its exclusion from the dataset does not appear to have a significant impact on the overall results of the analysis.
BAT recent market information
25In February 2024, BAT reported a £17.96 billion loss before tax for its 2023 financial year, mainly caused by slightly lower revenues and an impairment charge of £27.6 billion. The loss before tax also resulted in a loss per share of 646.6 pence, significantly lower than the previous year's profit per share of 292.9 pence.
26BAT's annual report notes that the £27.6 billion impairment charge is "mainly related to the Newport, Camel, Pall Mall and Natural American Spirit acquired brands and was caused by:
- stricter regulation and potential menthol ban in the US;
- economic challenges in the United States, where some inflationary weary consumers are downgrading to cheaper brands;
- the rise of disposable vapes; and
- the company's vision to “build a smokeless world” with a target of 50% of revenue from non-combustibles by 2035.”
27BAT Chief Executive described the move as “accounting catching up with reality" and while he "did not believe that cigarettes would disappear in 30 years, it was no longer possible to justify an indefinite value for brands that currently equate to $80 billion on BAT's balance sheet".5
28Following the announcement, the Group experienced a sudden decrease in their share price. By the end of the trading day, BAT's share price had fallen 8% which equated to a £4 billion loss in market capitalisation. The share price eventually recovered, about six months later, which would suggest that this was not a momentary market reaction.
29As the impairment charge was a non-cash item, operating cashflows of the entity were hardly affected. The groups earnings before interest, tax, depreciation and amortisation (EBITDA) remained relatively stable in 2023 (£12.5 billion.) compared to earlier years (2022: £11.6 billion., 2021: £10.9 billion). Additionally, operating cash flows also remained stable. This suggests that the impairment charge was not related to short-term cash flow.
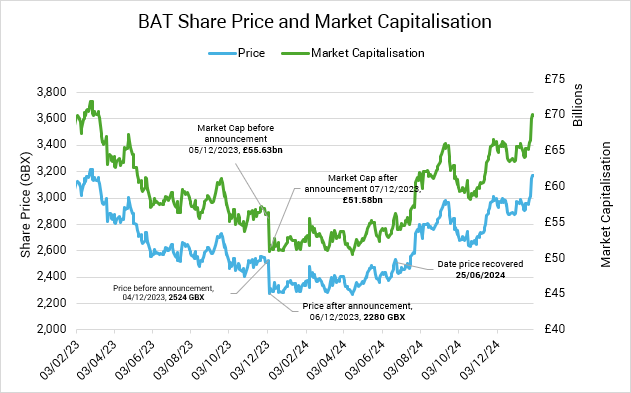
30The market's reaction to the impairment may indicate that intangible assets are value relevant, given the sudden decrease and prolonged length of recovery in the stock price.
Questions for the board
- Does the Board have any comments on the updated information from the report?