6 Rate-regulated Activities – UKEB Top-down Approach
28 March 2024 Agenda Paper 6
Executive Summary
| Project Type | Influencing |
|---|---|
| Project Scope | Significant |
Purpose of the paper
The purpose of this paper is update the Board on the development of an alternative top-down approach that could be used for UK rate-regulated entities to recognise regulatory assets and regulatory liabilities on a comprehensive basis.
The Board's input is specifically requested on the RRA TAG papers 2A and 2B. The remaining papers, 2C and 2D, require further input from the RRA TAG before being discussed at the Board. They have been provided for reference and completeness.
Summary of the Issue
- The IASB published an Exposure Draft (ED) Regulated Assets and Regulated Liabilities in January 2021. The IASB is currently redeliberating the proposals. It is expected that a standard will be published in 2025.
- The IASB tentatively decided to clarify that a rate-regulated entity is:
- Required to recognise the timing differences that go directly to RCB only when it has a direct relationship between its property, plant and equipment (PPE) and regulatory capital base (RCB).
- Not permitted to recognise the timing differences that go directly to RCB when an entity does not have a direct relationship between its PPE and RCB.
This IASB tentative decision will provide a comprehensive approach to the recognition of timing differences for rate-regulated entities with a direct relationship.
Almost all UK rate-regulated entities do not have a direct relationship between PPE and RCB. As such, no UK rate-regulated entities will be able to recognise their regulated assets or regulated liabilities relating to RCB under the IASB's proposals.
The UKEB Secretariat's initial work has identified that only approximately 40% of the total timing differences would be recognised for UK water entities. Further work is required to determine the ratio for other types of regulated entities in the UK.
- An IASB survey in 2023 identified that approximately 50% of entities within the scope of the standard appear to be in the no direct relationship category.
- The concerns with this approach are as follows:
- Will partial recognition of timing differences for entities with a no direct relationship be understandable to users?
- Is partial recognition of timing differences by approximately 50% of rate-regulated entities with no direct relationship appropriate?
- Does it lead to a lack of comparability between direct and no direct relationship entities?
- Is a lack of a level playing field between direct and no direct relationship entities appropriate?
- Will the benefits for preparers with a no direct relationship between PPE and RCB, of recognising only approximately 40% of the timing differences, outweigh the costs?
- UKEB top-down approach considers how timing differences reflected in RCB for no direct relationship entities could be recognised and whether they could be monitored and tracked.
- Top-down approach uses entities in the UK water industry as an example and considers:
- The timing differences recognised in RCB and amounts in Allowed Revenue can be tracked by the tables published by Ofwat.
- The amounts are tracked at a business line level, the level monitored and approved by the regulator on a yearly basis.
- The top-down approach looks at the recognition of timing differences reflected in RCB for no direct relationship entities. It does not affect the other IASB proposals and tentative decisions, such as measurement and presentation in the ED.
- The RRA TAG will be discussing these papers the day before the Board meeting and we will give an oral update on the discussion to the Board.
- The UKEB Secretariat is consulting with other NSS. The AcSB and OIC Secretariats have agreed to give us feedback on our proposed top-down approach.
- This issue will be discussed at ASAF a few days before the Board meeting and we will give an oral update on the discussion to the Board.
Questions for the Board
Does the Board:
- Consider that the alternative top-down approach is understandable?
- Consider that there are issues, conceptual or practical, with the top-down approach?
- Agree that the UKEB Secretariat should continue to develop this approach?
Recommendation
N/A
RRA TAG Papers
Paper 2A: Background Paper 2B: Example Paper 2C: Unit of account [For information only: will require further discussion at RRA TAG] Paper 2D: Inflation [For information only: will require further discussion at RRA TAG]
Appendix A: UKEB top-down approach—Background
Introduction
1The IASB published an Exposure Draft (ED) Regulatory Assets and Regulatory Liabilities in January 2021. The IASB is currently redeliberating the proposals and it is expected that a standard will be published in 2025.
2Subsequent to the publication of the ED, the IASB tentatively decided to clarify that a rate-regulated entity is required to recognise the timing differences that are reflected in Regulatory Capital Base (RCB) only when there is a direct relationship between its property, plant and equipment (PPE) and regulatory capital base (RCB). For those rate-regulated entities that do not have a direct relationship between PPE and RCB those timing differences are not permitted to be recognised.
3The RCB:
"includes the amounts invested by the entity in the assets that are used to supply goods or services. The recovery of the investments through the depreciation of the regulatory capital base and the regulatory returns on that base are key sources of revenue for regulated entities. 1"
4This tentative decision provides a more complete model for the recognition of timing differences for rate-regulated entities with a direct relationship than for rate-regulated entities with a no direct relationship. The ED and IASB tentative decisions will therefore more closely reflect the underlying economics in the financial statements only for those entities with a direct relationship between PPE and RCB.
5Almost all UK rate-regulated entities do not have a direct relationship between PPE and RCB. The UKEB Secretariat's work so far has identified that only approximately 40% of the total timing differences would be recognised for UK water entities. Further work is required to determine the ratio for other types of regulated entities in the UK.
6An IASB survey in 2023 identified that approximately 50% of entities appear to be in the no direct relationship category.
7The objective of the IASB's project is to make the financial statements of companies subject to rate regulation more useful and more comparable. The concerns with the IASB's proposed approach include:
- Will partial recognition of timing differences for entities with a no direct relationship result in financial information that is useful? Will it be relevant and understandable to users? How will users be able to compare performance between direct and no direct relationship entities? There is a risk that it will fail to be met for a large proportion of affected entities.
- Could partial recognition of timing differences for approximately 50% of rate-regulated entities have a negative impact on those entities' relative attractiveness to investors and competitiveness?
- For no direct relationship entities, will the benefits for preparers and users of recognising approximately 40% of the timing differences, and associated disclosures, outweigh the related costs?
Purpose
8The purpose of this paper is to explore whether another approach could be used for entities with a no direct relationship so that they are also able to recognise timing differences that go directly to RCB. This paper is divided into four parts:
- 2A (this paper): Background: ED proposals, subsequent IASB tentative decisions and an illustration of common sources of differences in timing. Appendix A describes the UK water industry model. Appendix B describes timing differences using three classes: base model, items affecting regulatory rates on a cash basis and incentive mechanisms.
- 2B: Example: Description of a top-down approach, and two examples: Approach A: Tracking total additions and total inflation and Approach B: Tracking difference between PPE and RCB.
- 2C: Unit of account: Analysis of the unit of account with the top-down approach.
- 2D: Inflation: Description and examples of the nominal model and the existing UK real model, and explanation of the IASB tentative decision on this topic.
Background
ED proposals
9Broadly speaking:
"Rate regulation can significantly affect the amount and timing of a company's revenue, profit and cash flows by specifying: - how much compensation the company can charge customers for goods or services supplied in a period—the Exposure Draft calls this 'total allowed compensation'; and - when the company can include that compensation in the rates it charges customers. 2"
10The ED proposes that:
- "an entity would recognise a regulatory asset, and the associated regulatory income, if part of the total allowed compensation for goods or services the entity has already supplied will be included in revenue in the future.
- an entity would recognise a regulatory liability, and the associated regulatory expense, if the revenue the entity has already recognised includes an amount that will provide part of the total allowed compensation for goods or services that it will supply in the future. 3"
11The definitions of a regulatory asset, regulatory liability and total allowed compensation are as follows:
"Regulatory asset: An enforceable present right, created by a regulatory agreement, to add an amount in determining a regulated rate to be charged to customers in future periods because part of the total allowed compensation for goods or services already supplied will be included in revenue in the future.”
“Regulatory liability: An enforceable present obligation, created by a regulatory agreement, to deduct an amount in determining a regulated rate to be charged to customers in future periods because the revenue already recognised includes an amount that will provide part of the total allowed compensation for goods or services to be supplied in the future."
"Total allowed compensation (for goods or services): The full amount of compensation for goods or services supplied that a regulatory agreement entitles an entity to charge customers through the regulated rates, in either the period when the entity supplies those goods or services or a different period.
12In regulatory agreements, the regulator and the entity agree to the total amount the entity is permitted to recover in a period through the regulated rates charged to customers. This is usually called “Allowed Revenue”. Other commonly used terms are "revenue requirement” or “authorised revenue” or “allowable revenue”. This is then divided by the number of units estimated to be used by customers to get to the regulated rate (per unit).
Subsequent IASB tentative decisions
13Through feedback received during the redeliberations, the IASB tentatively decided that 4:
- "an entity is required to recognise a regulatory asset or a regulatory liability relating to an allowable expense or performance incentive included in its regulatory capital base when:
- the entity's regulatory capital base and its property, plant and equipment have a direct relationship; and
- the entity has an enforceable present right (obligation) to add (deduct) the allowable expense or performance incentive to (from) future regulated rates.
- an entity is [not] permitted to recognise a regulatory asset or a regulatory liability relating to an allowable expense or performance incentive included in its regulatory capital base when the entity's regulatory capital base and its property, plant and equipment have no direct relationship."
14In the UK, almost all rate-regulated entities have no direct relationship between PPE and RCB. Consequently, they will only be able to recognise regulatory differences that directly affect Allowed Revenue.
15In 2023, the IASB undertook a survey to see whether the direct (no direct) relationship concept would work. It found that:
"The direct (no direct) relationship concept seems to be an appropriate approach for determining whether differences in timing arise from the regulatory compensation an entity receives on its regulatory capital base in a variety of regulatory schemes. 5"
16It found that approximately 50% of the entities surveyed had a direct relationship between PPE and RCB and approximately 50% did not have a direct relationship.
Illustration of common sources of differences in timing
17The following IASB diagram illustrates differences in timing and whether the direct or no direct relationship makes a difference to the recognition of those timing differences:
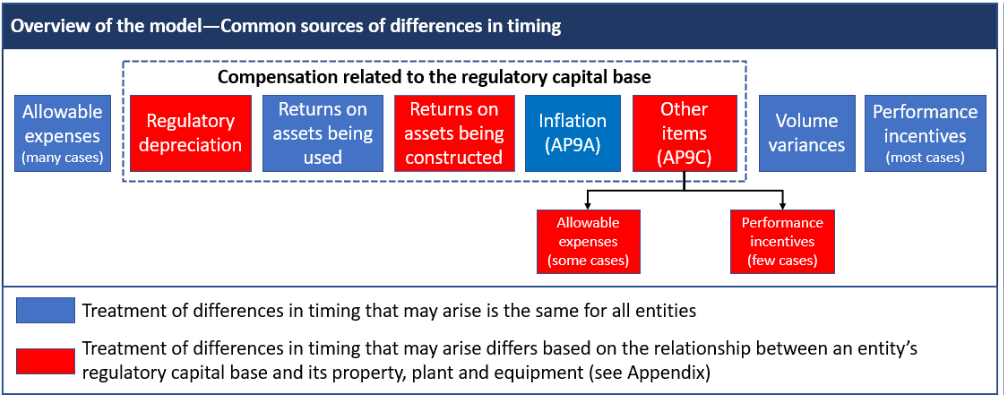
18The diagram shows the common sources of differences in timing and whether the accounting treatment is the same for entities in both the direct and no direct models by highlighting them in blue. The diagram lists:
- Allowable expenses (e.g. input costs that are higher than estimated).
- Returns on assets being used.
- Volume variances.
- Performance incentives.
19The diagram also refers to inflation. The ED does not permit inflation to be recognised as a separate source of timing difference, irrespective of whether there is a direct (no direct) relationship between the entity's PPE and its RCB. This decision appears to treat all entities equally. However, some regulatory frameworks use a real interest rate model which splits the return on capital from the inflation whereas others use a nominal interest rate approach which includes both the return on capital and inflation. This appears to create an additional comparability issue between the direct (no direct) relationship entities. See Paper 2D which specifically discusses inflation.
20An alternative depiction of the sources of timing difference is as follows:
| Regulatory agreement—permitted adjustments | |
|---|---|
| Direct relationship between PPE and RCB | No direct relationship between PPE and RCB |
| Allowable expenses (many cases) | Allowable expenses (many cases) |
| Volume variances | Volume variances |
| Performance incentives (most cases) | Performance incentives (most cases) |
| Returns on assets being used | Returns on assets being used |
| Regulatory depreciation | – |
| Returns on assets being constructed | – |
| Other items (AP9C) |  |
| Allowable expenses (some cases) | Performance incentives (few cases) |
21The revised diagram makes clear the types of timing differences that are recognised depending on the entity's type of regulatory agreement. It shows that entities with a no direct relationship are not permitted to recognise as many adjustments as entities with a direct relationship.
Question for RRA TAG members
1Do TAG members consider that the revised diagram clearly sets out the types of timing differences that are recognised, depending on the entity's type of regulatory agreement?
Regulatory asset and regulatory liability
22The definition of a regulatory asset is as follows:
| Regulatory asset definition | Application to fact pattern |
|---|---|
| An enforceable present right, created by a regulatory agreement, ... | The regulatory agreement entitles the entity to recover amounts charged to the RCB through regulatory depreciation and return on capital. |
| ... to add an amount in determining a regulated rate to be charged to customers in future periods because part of the total allowed compensation for goods or services already supplied will be included in revenue in the future. | The amount calculated for regulatory depreciation and return on capital are added to the allowable revenue. The total allowed revenue is then used to calculate the regulated rate. |
23The definition of a regulatory liability is as follows:
| Regulatory liability definition | Application to fact pattern |
|---|---|
| An enforceable present obligation, created by a regulatory agreement, ... | The regulatory agreement requires the entity to deduct amounts charged to the RCB through charging a lower amount of regulatory depreciation and return on capital. |
| ... to deduct an amount in determining a regulated rate to be charged to customers in future periods because the revenue already recognised includes an amount that will provide part of the total allowed compensation for goods or services to be supplied in the future. | A lower amount is calculated for regulatory depreciation and return on capital. This lower amount is added to the allowable revenue. The total allowed revenue is then used to calculate the regulated rate. |
24It seems that the timing differences going directly to RCB meet the IASB's definitions of regulatory asset and regulatory liability.
Direct (no direct) relationship
25The IASB's current proposals an entity is required to recognise a regulatory asset or a regulatory liability relating to an allowable expense or performance incentive included in its RCB only when it has a direct relationship between its PPE and RCB (and there is an enforceable present right or obligation to add/deduct to/from future regulated rates).
26This requirement means that an entity needs to have an ability to trace differences between its PPE and RCB at an asset level. This is possible under a direct relationship where the entity also uses a nominal interest model because RCB also uses historic cost.
27The requirement for a direct relationship so that timing differences in RCB can be recognised is not met for entities with UK regulatory agreements. This is because the value of RCB is at current cost whilst PPE uses a historic cost model.
28There may be a different way to approach this requirement for entities with no direct relationship between PPE and RCB. UK regulatory agreements require rate-regulated entities to keep detailed records relating to the lines of business within the regulatory agreement. This means the amounts are tacked and monitored. There is no lower unit of account. The top-down approach uses these amounts.
UK water industry regulatory model
29Appendix A describes the UK water industry model for the period 2025–2030.
Question for RRA TAG members
2Do TAG members consider that Appendix A is reflective of other UK rate-regulated industries? If not, how might it differ?
Regulatory timing differences for the UK water industry
30Appendix B describes timing differences in the UK water industry using three classifications:
- base model (including return of capital (i.e. regulatory depreciation (RCV run-off) and inflation);
- items affecting regulatory rates on a cash basis; and
- incentive mechanisms.
Question for RRA TAG members
3Do TAG members consider that Appendix B is reflective of other UK rate-regulated industries? If not, how might it differ?
Annex A: UK water industry regulatory model
A1A summary of the rate-regulated business model (using a real model for inflation) applying to the water industry in England & Wales for the period 2025–2030 is set out below.
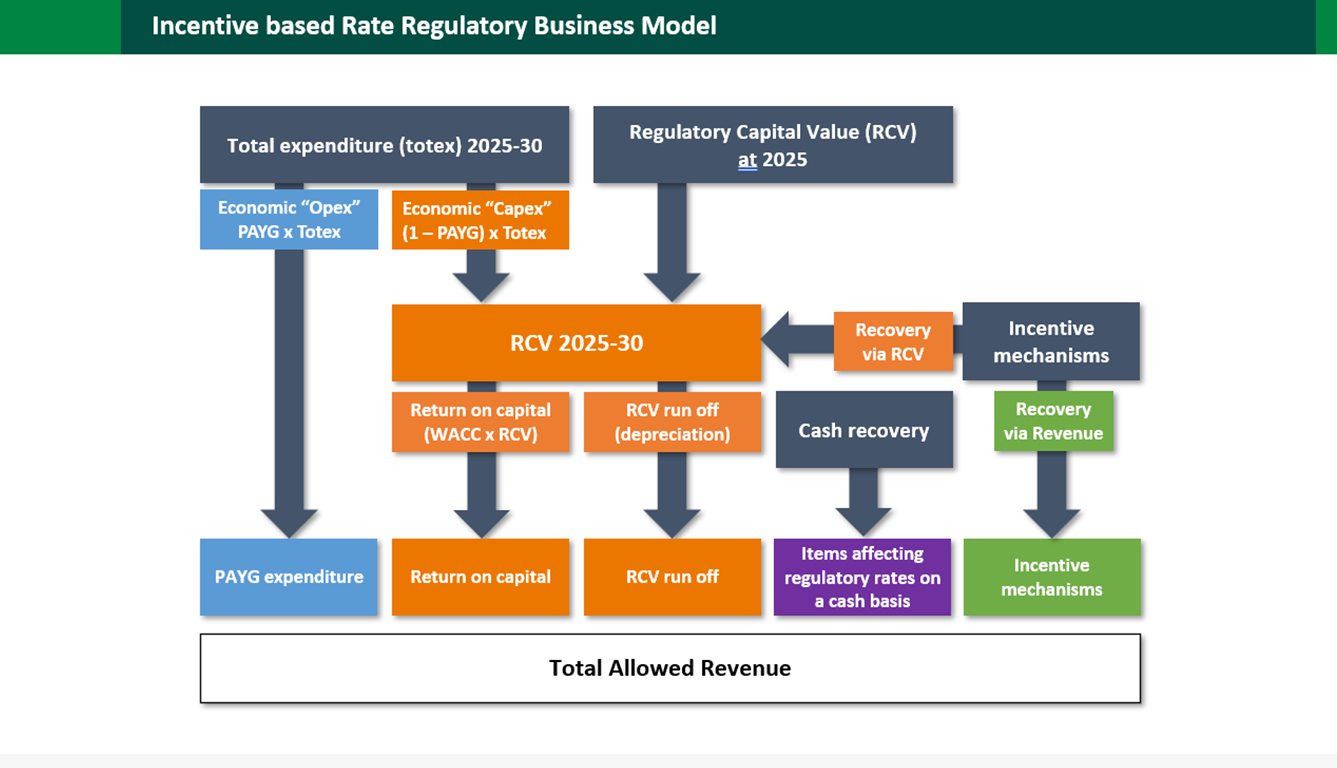
A2Total Allowed Revenue comprises these components:
- Pay As You Go (PAYG) expenditure: which is the regulator's economic assessment of operating costs that will be incurred in the period.
- Capital consumption: which comprises two components being:
- Return on Capital: which is the regulator's economic assessment of the return allowed in real terms; and
- Regulatory depreciation (RCV Run-off): which is the regulator's economic assessment of depreciation of the RCV which is consumed in the period.
- Items affecting regulatory rates on a cash basis: which is the regulatory allowance for items resulting in cash expenditure. This includes for example: cash tax; pension costs; decommissioning liabilities etc.
- Incentive mechanisms: which comprise the regulators assessment ex-post of adjustments for revenue, costs and/or service performance.
A3These components of revenue are derived from the basic building blocks of the rate regulatory business model, and described in the following paragraphs.
Total expenditure (Totex)
A4Total expenditure (Totex) is the total expenditure (Opex and Capex) that is assessed by the regulator for the five-year review period 2025 to 2030. The regulator assesses how much of this total expenditure will be allowed in customer bills during the five-year review period which is broadly equivalent to the operating costs the company is expected to incur. This component of Totex is referred to as PAYG expenditure, is set as a percentage of the overall Totex and is allowed as immediate recovery through revenue in the regulatory period. The balance that remains, which is broadly equivalent to the capital expenditure the company is expected to incur, is added to the Regulatory Capital Value (RCV).
Regulatory Capital Value (RCV)
A5The regulatory capital value (RCV) is the amount of revenue that is carried forward into future regulatory periods rather than being Allowed Revenue in the period. The ED calls RCV the Regulatory Capital Base (RCB). The opening RCV balance at 2025 increases in value through the 2025 to 2030 period by virtue of the Totex expenditure that is deferred into future periods. During the period the allowed revenue recovered from customers reflects both a return on capital and a return of capital (regulatory depreciation (RCV run-off)) with the RCV being reduced by the amount of regulatory depreciation (RCV run-off). Under the rate-regulated business model that uses a real inflation model, the RCV is also increased by inflation. This is equivalent in many respects to a current cost model for PPE in financial reporting terms.
Items affecting regulatory rates on a cash basis
A6Items affecting regulatory rates on a cash basis are items that the regulator only allows when the company is expected to incur the cash costs associated with activity. So for example, the tax amount in Allowed Revenue represents the cash tax expected to be paid, there is no allowance for deferred tax that will be paid in the future.
Incentive mechanisms
A7Incentive mechanisms are the regulator's assessment ex-post of adjustments for revenue, costs and/or service performance. These adjustments may give rise to either:
- revenue adjustments in period (e.g. within a 5-year regulatory period, an adjustment for the first year in the regulatory period is incorporated into Allowed Revenue in years 3–5) or at the end of a regulatory period (e.g. at 2030 with recovery in the following regulatory period 2031–2035); or
- Longer term deferred revenue adjustments which are recovered through addition to the RCB.
Annex B: UK water industry regulatory timing differences
B1Conceptually there are three classes of timing difference that arise under rate-regulated business models. These are:
- base model (including return of capital (i.e. regulatory depreciation (RCB run-off) and inflation);
- items affecting regulatory rates on a cash basis; and
- incentive mechanisms.
Base model
B2In financial reporting an entity's PPE represents the economic resource that is used to generate future cashflows, which represent both the return of the capital invested in the asset and a financial return on that investment (return on capital).
B3Under a rate-regulated business model, the RCB is the equivalent economic resource, as it represents the present value of the future cashflows the regulator will include in Allowed Revenue over future regulatory periods.
B4The timing difference can be thought of as the difference between the revenue that can be generated by an entity's PPE and the revenue that can be generated from its RCB.
B5The base model timing differences therefore represent the difference between recognition of the entity's assets under IFRS and the regulatory amount recoverable.
Items affecting regulatory rates on a cash basis
B6These generally relate to long term liabilities that have been incurred by the entity but where settlement of the liability will be in future regulatory determination periods.
B7Regulators only allow a recovery from customers in Allowed Revenue when settlement is expected to occur. This means that these liabilities are unfunded.
B8Unfunded regulatory liabilities include items such as Deferred Tax, Pensions, and Decommissioning Costs, etc.
B9Conceptually the reverse can also arise with the Regulator allowing recovery from customers in Allowed Revenue for amounts where liabilities have not yet been recognised, although this is not common in the UK.
B10The items affecting regulatory rates on a cash basis therefore reflect the difference between recognition of the entity's liabilities under IFRS and the regulatory amount recoverable.
Incentive mechanisms
B11These comprise a mixture of:
- Revenue-based forecasting incentives: which both incentivises accurate revenue forecasting and corrects for under/over recovery of revenue associated with demand forecasts.
- Cost-based performance incentives: such as Totex pain/gain sharing, being the extent to which services have been delivered for more or less than the allowed cost.
- Service-based performance incentives: such as Customer Minutes Lost, being the amount of time on average that customers were without service.
B12In the UK water industry there are approximately 20–30 such mechanisms. Each is tracked individually and can result in adjustments to both Allowed Revenue (short term recovery) and the RCV (long term recovery).
B13Adjustments are measured as a comparison of actual performance and that expected under the regulatory determination (typically a regulatory determination is approximately 5–8 years) with adjustments generally being made to Allowed Revenue within the determination period or in the following determination period. Some adjustments are made to RCV and recovered over a longer period.
B14These incentive mechanism timing differences therefore represent the difference between customer derived IFRS 15 Revenue from Contracts with Customers revenue and the regulatory Allowed Revenue for a future period.
Appendix B: UKEB top-down approach—Example
Introduction
1The UKEB is considering whether the IASB's proposed approach could be extended to reflect the underlying economics in cases when there is no 'direct relationship' between a rate-regulated entity's PPE and its RCB. Extending the IASB's model would permit timing differences reflected in the RCB to be recognised in financial statements. This includes demonstrating how these timing differences are tracked and reversed (recovered).
2In cases when there is a direct relationship between PPE and RCB the timing differences that are reflected in RCB can be reconciled to the PPE amounts in the financial statements and are tracked on that basis. This is possible under a direct relationship where the entity also uses a nominal interest model because RCB also uses historic cost. In effect, this might be considered a “bottom-up” approach.
3UK entities (no direct relationship entities) cannot reconcile between PPE and RCB because the value of RCB is at current cost whilst PPE uses a historic cost model. However, the UKEB Secretariat considers that a “top-down” approach could be used: such an approach would also permit timing differences to be tracked.
4The top-down approach looks at the recognition of timing differences in RCB for no direct relationship entities. It does not affect the other proposals such as measurement and presentation in the ED.
The top-down approach
5Instead of involving a detailed reconciliation between PPE and RCB, the top-down approach tracks the total amounts that a rate-regulated entity agrees with its regulator. These amounts have reliability built in as the regulator verifies and approves them on a yearly basis.
6Appendix A sets out the relevant tables needed for this purpose that can be found for each regulated entity, including the amounts relating to RCB for an Ofwat-regulated entity.
7In essence, the approach would permit recognition of timing differences in respect of RCB adjustments based on the total difference between PPE and RCB by year and by line of business.
Worked example
8The example below uses a hypothetical UK entity in the water sector. This entity would be regulated by Ofwat. Its regulatory agreement is set out in its licence and the methodology framework is used by its regulator Ofwat in applying the terms of the licence.
9Such an entity completes comprehensive regulatory reporting submissions (the Annual Performance Report) annually as well as submitting comprehensive long term business plans through the 5-year price review process. These regulatory submissions also require population of detailed models for the individual regulatory mechanisms that give rise to the regulatory assets and liabilities. Once approved by Ofwat these spreadsheets are published on the Ofwat website.
10Ofwat requires entities to operate a 5-year regulatory period, for which the Allowed Revenue and RCB for that period are approved. Entities are also required to complete spreadsheets each year to access progress against the 5-year plan. These are also reviewed and approved by Ofwat.
11Appendix A sets out where the information could be obtained for an Ofwat regulated entity.
12The example is built on the same existing UK real model example presented in the paper on inflation (paper 2D), to illustrate a proposed accounting approach and how this could work to provide a better representation of the economics under the real model of rate regulation. This proposed approach uses the same simplified example to allow comparison.
13Figure 3a below sets out a summary illustration for the proposed top-down approach (called the proposed real model in the following pages).
| REGULATORY MODEL BUILDING BLOCKS | 20X0 £m | 20X1 £m | 20X2 £m | 20X3 £m | 20X4 £m | 20X5 £m | 20X6 £m | 20X7 £m | 20X8 £m | 20X9 £m | 20Y0 £m |
|---|---|---|---|---|---|---|---|---|---|---|---|
| RAB | |||||||||||
| Open balance | 100.000 | 91.800 | 83.232 | 74.285 | 64.946 | 55.204 | 45.046 | 34.461 | 23.433 | 11.951 | |
| Inflation | 2.000 | 1.836 | 1.665 | 1.486 | 1.299 | 1.104 | 0.901 | 0.689 | 0.469 | 0.239 | |
| Inflated open balance | 102.000 | 93.636 | 84.897 | 75.770 | 66.245 | 56.308 | 45.947 | 35.150 | 23.902 | 12.190 | |
| Depreciation | (10.200) | (10.404) | (10.612) | (10.824) | (11.041) | (11.262) | (11.487) | (11.717) | (11.951) | (12.190) | |
| Close balance | 100.000 | 91.800 | 83.232 | 74.285 | 64.946 | 55.204 | 45.046 | 34.461 | 23.433 | 11.951 | 0.000 |
| Allowed Revenue | |||||||||||
| Return on capital (WACC x RAB) | 3.060 | 2.809 | 2.547 | 2.273 | 1.987 | 1.689 | 1.378 | 1.054 | 0.717 | 0.366 | |
| Return of capital (depreciation) | 10.200 | 10.404 | 10.612 | 10.824 | 11.041 | 11.262 | 11.487 | 11.717 | 11.951 | 12.190 | |
| Opex allowance | 5.000 | 5.100 | 5.202 | 5.306 | 5.412 | 5.520 | 5.631 | 5.743 | 5.858 | 5.975 | 6.095 |
| Revenue | 18.360 | 18.415 | 18.465 | 18.510 | 18.549 | 18.582 | 18.609 | 18.629 | 18.643 | 18.651 | |
| DCF | 0.952 | 0.906 | 0.862 | 0.821 | 0.781 | 0.744 | 0.708 | 0.674 | 0.641 | 0.610 | |
| Discounted Revenue | 17.476 | 16.684 | 15.923 | 15.193 | 14.492 | 13.818 | 13.172 | 12.552 | 11.956 | 11.385 | |
| PRIMARY FINANCIAL STATEMENTS | |||||||||||
| Income Statement | 20X0 £m | 20X1 £m | 20X2 £m | 20X3 £m | 20X4 £m | 20X5 £m | 20X6 £m | 20X7 £m | 20X8 £m | 20X9 £m | 20Y0 £m |
| Revenue | 18.360 | 18.415 | 18.465 | 18.510 | 18.549 | 18.582 | 18.609 | 18.629 | 18.643 | 18.651 | |
| RRA adjustment | 1.800 | 1.432 | 1.053 | 0.661 | 0.258 | (0.158) | (0.586) | (1.027) | (1.482) | (1.951) | |
| Adjusted revenue | 20.160 | 19.847 | 19.518 | 19.171 | 18.807 | 18.424 | 18.023 | 17.602 | 17.161 | 16.700 | |
| Operating costs | (5.100) | (5.202) | (5.306) | (5.412) | (5.520) | (5.631) | (5.743) | (5.858) | (5.975) | (6.095) | |
| Depreciation | (10.000) | (10.000) | (10.000) | (10.000) | (10.000) | (10.000) | (10.000) | (10.000) | (10.000) | (10.000) | |
| Operating profit | 5.060 | 4.645 | 4.212 | 3.759 | 3.286 | 2.793 | 2.279 | 1.744 | 1.186 | 0.605 | |
| Net finance income/(expense) | (5.060) | (4.645) | (4.212) | (3.759) | (3.286) | (2.793) | (2.279) | (1.744) | (1.186) | (0.605) | |
| Retained profit | 0.000 | 0.000 | 0.000 | 0.000 | 0.000 | 0.000 | 0.000 | 0.000 | 0.000 | 0.000 | |
| Statement of Financial Position | |||||||||||
| Property plant & equipment | 100.000 | 90.000 | 80.000 | 70.000 | 60.000 | 50.000 | 40.000 | 30.000 | 20.000 | 10.000 | 0.000 |
| RRA adjustment | 1.800 | 3.232 | 4.285 | 4.946 | 5.204 | 5.046 | 4.461 | 3.433 | 1.951 | 0.000 | |
| Cash/(Debt) | (100.000) | (91.800) | (83.232) | (74.285) | (64.946) | (55.204) | (45.046) | (34.461) | (23.433) | (11.951) | (0.000) |
| Net assets | 0.000 | 0.000 | 0.000 | 0.000 | 0.000 | 0.000 | 0.000 | 0.000 | 0.000 | 0.000 | 0.000 |
| Cashflow | |||||||||||
| Operating profit | 5.060 | 4.645 | 4.212 | 3.759 | 3.286 | 2.793 | 2.279 | 1.744 | 1.186 | 0.605 | |
| Adj: RRA adjustment | (1.800) | (1.432) | (1.053) | (0.661) | (0.258) | 0.158 | 0.586 | 1.027 | 1.482 | 1.951 | |
| Add: Depreciation | 10.000 | 10.000 | 10.000 | 10.000 | 10.000 | 10.000 | 10.000 | 10.000 | 10.000 | 10.000 | |
| Add: Net finance income/(expense) | (5.060) | (4.645) | (4.212) | (3.759) | (3.286) | (2.793) | (2.279) | (1.744) | (1.186) | (0.605) | |
| Net Cashflow | 8.200 | 8.568 | 8.947 | 9.339 | 9.742 | 10.158 | 10.586 | 11.027 | 11.482 | 11.951 |
14The upper section of Figure 3a summarises the regulatory model building blocks for RCB and Allowed Revenue. This is identical to the existing UK real model set out in Figure 2 in paper 2B.
15The lower section of Figure 3a summarises the primary financial statements under current IFRS reporting together with a proposed Rate-regulated Activities (RRA) Adjustment (the timing difference).
16The RRA Adjustment (i.e. regulatory asset) on the Statement of Financial Position represents the difference between the PPE closing balance and the RCB closing balance. The RRA Adjustment (i.e. regulatory income (regulatory expense)) in the Income Statement represents the movement in RRA Adjustment (regulatory asset) on the Statement of Financial Position.
17The Income Statement comprises revenue billed to customers in the period which is unchanged from the existing real model. The RRA revenue adjustment (regulatory income (regulatory expense)) builds up and then unwinds over the period. The operating costs incurred and the historic cost accounting depreciation are also unchanged from the existing real model.
18This results in the operating profit comprising the real return on capital which progressively switches to being the excess return of capital together with the RRA Adjustment to revenue. The operating profit under the proposed real model is slightly different to the operating profit under the current nominal model due to the impact of the financing component of the RRA Adjustment to revenue.
19The net finance expense represents the financing impact of the net debt balance. This results in a retained profit that is zero with the financing expense equating to the operating profit including the RRA adjustment to revenue.
20The Statement of Financial Position reflects the unwind of the PPE and debt balance along with the RRA Adjustment.
21The Cashflow reflects the operating profit, adjusted for depreciation, the RRA Adjustment to revenue and the financing charge on the debt balance.
Calculations for the RRA adjustment (regulatory asset)
22Figure 3b below sets out the details for the calculation of the RRA Adjustment (regulatory asset) to revenue.
| REGULATORY ADJUSTMENT | 20X0 £m | 20X1 £m | 20X2 £m | 20X3 £m | 20X4 £m | 20X5 £m | 20X6 £m | 20X7 £m | 20X8 £m | 20X9 £m | 20Y0 £m |
|---|---|---|---|---|---|---|---|---|---|---|---|
| RRA adjustment | |||||||||||
| RAB Close balance | 91.800 | 83.232 | 74.285 | 64.946 | 55.204 | 45.046 | 34.461 | 23.433 | 11.951 | 0.000 | |
| PPE Close balance | 90.000 | 80.000 | 70.000 | 60.000 | 50.000 | 40.000 | 30.000 | 20.000 | 10.000 | 0.000 | |
| Close balance timing difference | 1.800 | 3.232 | 4.285 | 4.946 | 5.204 | 5.046 | 4.461 | 3.433 | 1.951 | 0.000 | |
| Net movement in timing difference (RRA Adjustment) | 1.800 | 1.432 | 1.053 | 0.661 | 0.258 | (0.158) | (0.586) | (1.027) | (1.482) | (1.951) | |
| RRA adjustment - split of revenue and financing components | |||||||||||
| Actual revenue - nominal model | 20.160 | 19.756 | 19.354 | 18.954 | 18.556 | 18.161 | 17.767 | 17.376 | 16.987 | 16.601 | |
| Actual revenue - real model | 18.360 | 18.415 | 18.465 | 18.510 | 18.549 | 18.582 | 18.609 | 18.629 | 18.643 | 18.651 | |
| Revenue difference between models | 1.800 | 1.341 | 0.889 | 0.445 | 0.008 | (0.421) | (0.841) | (1.253) | (1.656) | (2.050) | |
| Close balance timing difference | 1.800 | 3.232 | 4.285 | 4.946 | 5.204 | 5.046 | 4.461 | 3.433 | 1.951 | 0.000 | |
| Financing charge on close balance timing difference | 0.000 | 0.091 | 0.164 | 0.217 | 0.250 | 0.263 | 0.255 | 0.226 | 0.174 | 0.099 | |
| Actual revenue adjustment | 1.800 | 1.341 | 0.889 | 0.445 | 0.008 | (0.421) | (0.841) | (1.253) | (1.656) | (2.050) | |
| Financing charge unwind | 0.000 | 0.091 | 0.164 | 0.217 | 0.250 | 0.263 | 0.255 | 0.226 | 0.174 | 0.099 | |
| Net movement in timing difference (RRA Adjustment) | 1.800 | 1.432 | 1.053 | 0.661 | 0.258 | (0.158) | (0.586) | (1.027) | (1.482) | (1.951) |
23The RRA Adjustment (regulatory asset) on the Statement of Financial Position represents the difference between the closing RCB and PPE balances. This is a "top-down” comparison as it is not practicable to perform a "bottom-up” reconciliation of the two balances due to their fundamentally different underlying models (real model for RCB and historic cost for PPE). The RRA Adjustment (regulatory revenue (expense)) to revenue is the movement in the regulatory asset on the Statement of Financial Position.
24The RCB represents the present value of future cashflows to be received under the regulatory model. As such the RRA adjustment calculated in the previous paragraph implicitly includes the financing effect for the adjustment.
25The lower block of Figure 3b then illustrates the split of the RRA Adjustment to show the actual revenue impact and the financing charge impact. The actual revenue impact is the difference between the nominal and real model Allowed Revenue calculations. The financing adjustment is calculated based on the balance sheet RRA Adjustment. The two together represent the RRA Adjustment (regulatory revenue (expense)) for each period.
Comparing the proposed top-down approach with the existing business model examples
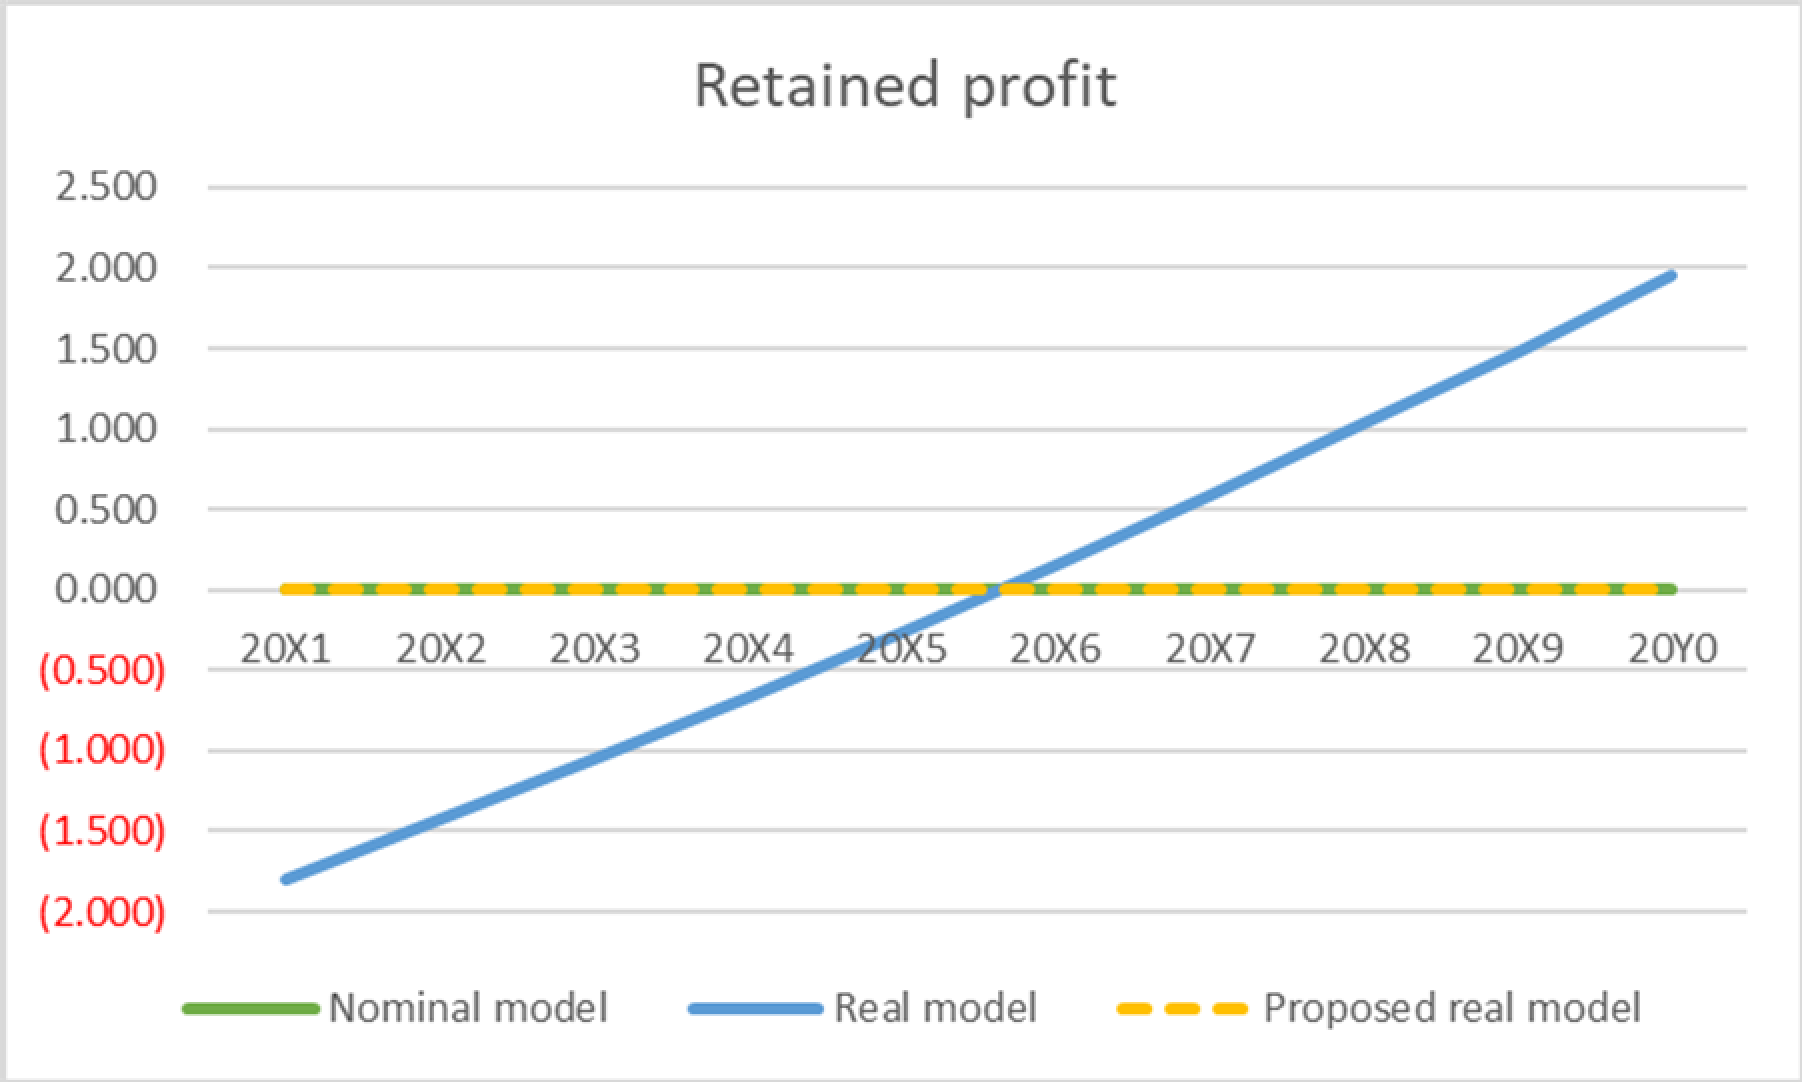
26The charts below summarise the operating profit and retained profit profiles for the two existing business models (in paper 2D) alongside the proposed top-down approach (called the “proposed real model”).
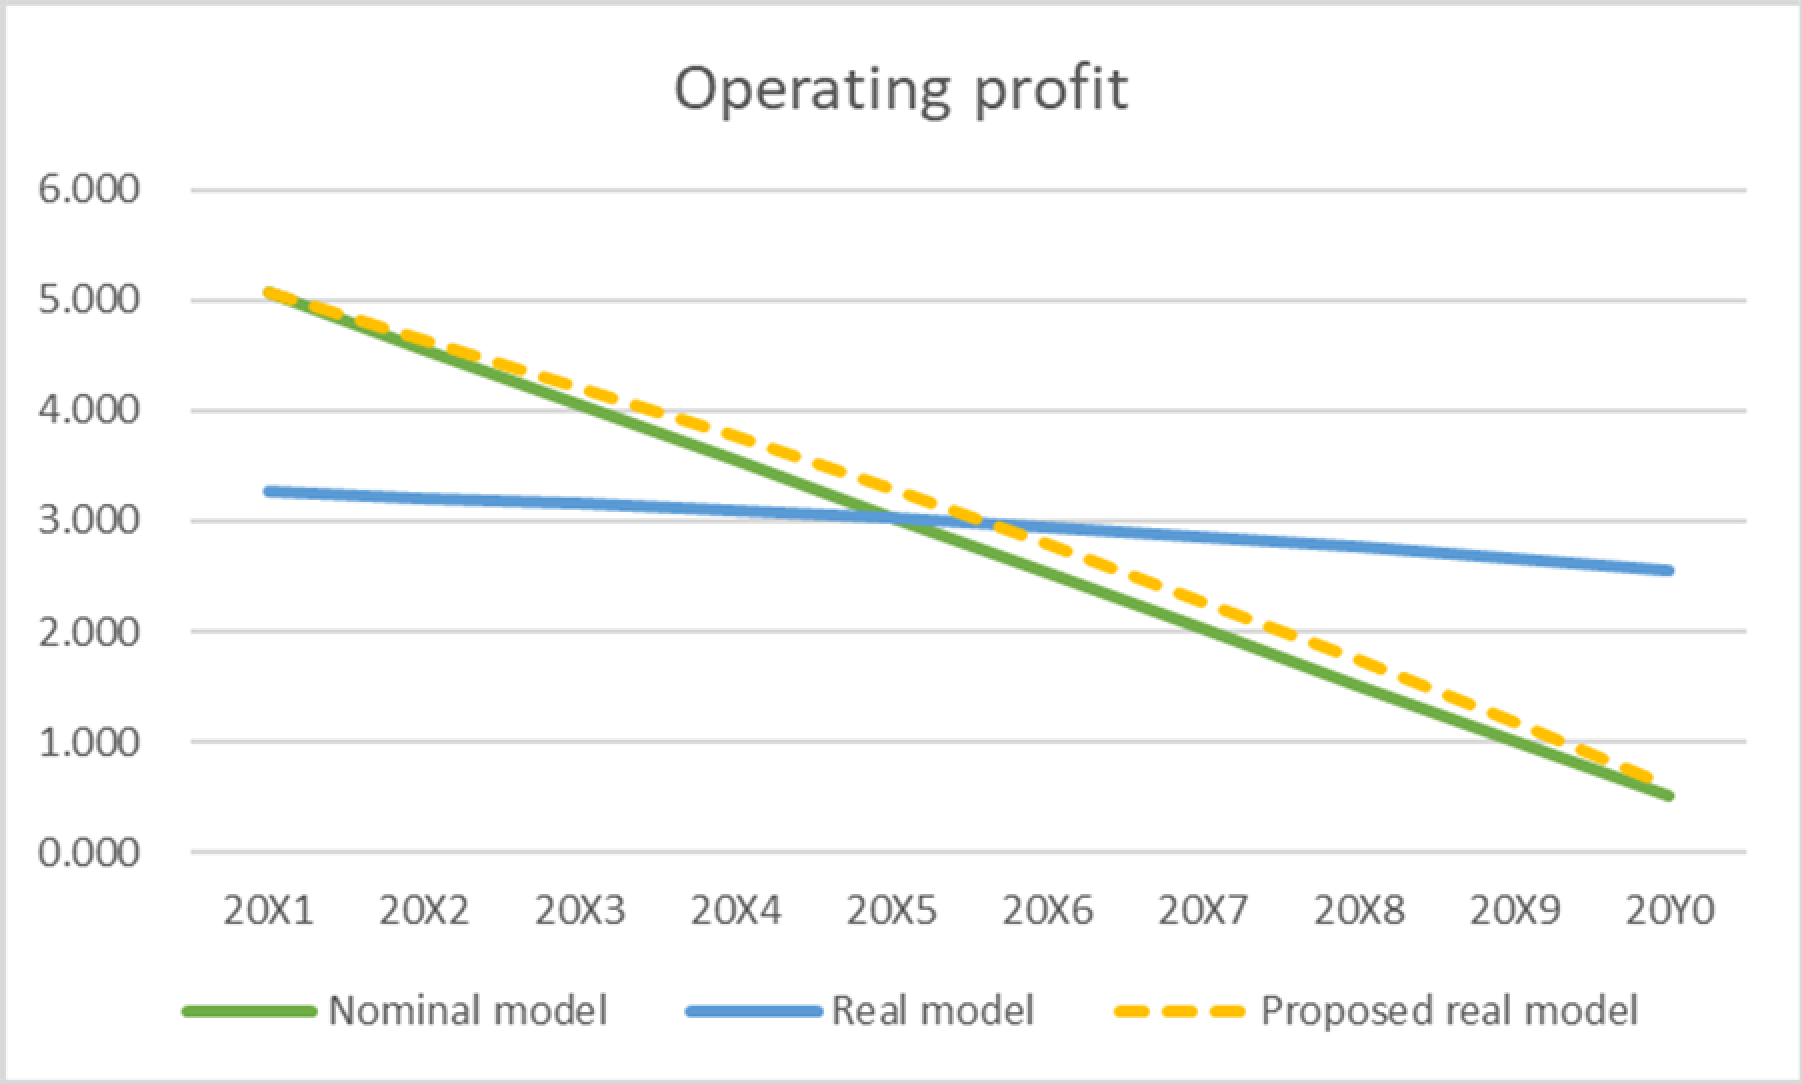
27The operating profit chart shows the same profile for the nominal model and the real model as illustrated in paper 2B. Alongside this is the profile for the proposed real model. This shows a slightly higher level of operating profit as it includes the financing charge implicit in the different revenue profiles.
28The retained profit chart shows the same profile for the nominal model and the real model as illustrated in paper 2B. Alongside this is the profile for the proposed real model. This shows that the proposed real model is exactly aligned with the nominal model as the extra financing charge under the real model is compensated by financing charge implicit in the revenue adjustment to the operating profile.
Alternative approach
29An alternative approach which would achieve similar outcomes could involve tracking total additions and total inflation by year. This alternative would reflect the following key facts:
- Timing differences recognised in RCB, such as additions (called non-PAYG Totex additions) and inflation (called indexation), are recovered from customers as permitted by the regulatory agreement.
- The RCB is amortised (regulatory depreciation - called RCV run-off) and that amortisation amount is added to the Allowed Revenue for a period. The Allowed Revenue is then used to determine the regulated rate charged to customers.
- The timing differences recognised in RCB and amounts in Allowed Revenue can be tracked in the tables published by Ofwat and populated by the entities and is already required by the regulatory agreement. This is at a business line level as that is the level which is monitored and approved by the regulator.
30A detailed worked example of this alternative approach will be brought to a future meeting.
Conclusion
31The IASB's approach will result in a lack of comparability between rate-regulated entities operating under the direct model (and using a nominal interest rate model) and those operating under the no direct model (and using a real interest rate model).
32The proposed approach for recognising timing differences between PPE and RCB would provide relevant information for financial reporting as it would highlight the different rate of consumption between PPE and RCB. It can be reliably measured on a cost-effective basis and gives a faithful representation of the economic position of the entity. As such it would also provide direct comparability between entities operating the under the direct model (and using a nominal interest rate model) and those operating under the no direct model (and using a real interest rate model).
33As the graph on retained profit above illustrates, there is an improvement in the comparability between the proposed real model (top-down approach) and the existing direct model (using a nominal interest rate model).
34The table below further summarises the reasons why timing differences between PPE and RCB arise and implications under the IASB approach and the alternative UKEB proposal.
Questions for RRA TAG members
1Do TAG members consider that changes to RCB are recovered from customers?
2Do TAG members consider that the proposed top-down approach fully reflects the underlying economics of a rate-regulated entity with no direct relationship between PPE and RCB?
3Could the proposed top-down approach be operationalised?
4Do TAG members consider that the information from the proposed approach would be understandable to users?
Annex A: Information on Ofwat website
The tables that can be found for each regulated entity which include information relating to RCB regulatory timing adjustments for an Ofwat-regulated entity are set out below:
| Item | Found here |
|---|---|
| Regulatory agreement. | Ofwat website - Final Determinations for PR19: https://www.ofwat.gov.uk/regulated-companies/price-review/2019-price-review/final-determinations/ Ofwat website – Price reviews for all price control periods: https://www.ofwat.gov.uk/regulated-companies/price-review/ |
| Timing differences recognised in RCB: • Additions 1 (called non-PAYG Totex additions). • Inflation (called indexation). |
Ofwat website – Regulatory Capital Value Updates: https://www.ofwat.gov.uk/publications/regulatory-capital-value-updates/ |
| Depreciation of RCB is in RCB reconciliation (called run-off). | Ofwat website - Financial model and rulebook for PR19: https://www.ofwat.gov.uk/regulated-companies/price-review/2019-price-review/data-tables-models/ - RCV run-off is on the 'RCV balance Summary' tab. Ofwat website – RCV adjustments feeder model for PR19: https://www.ofwat.gov.uk/publication/pr19-rcv-adjustments-feeder-model-published-june-2018/ – Indexation of the RCV is on the 'Calc' tab. |
| Allowed revenue includes the depreciation of RCB. | Ofwat website - Financial model and rulebook for PR19: https://www.ofwat.gov.uk/regulated-companies/price-review/2019-price-review/data-tables-models/ Allowed revenue calculation: 1. The full 5-year price control period is on the 'Dashboard' tab. 2. The annual profiles are on the ‘Exec Summary' tab. |
Annex B: Implications of timing differences in RCB under the IASB's proposed approach and the UKEB's Top-down approach
| Regulatory model | IASB's proposed approach | UKEB's Top-down approach |
|---|---|---|
| Inflation: The inflation return earned in a period is added to the RCV and recovered from customers in the future through increased/reduced regulatory depreciation (RCV run-off). | This inflation return is not recognised until it is included in future customer bills via increased/reduced regulatory depreciation (RCV run-off). | This inflation return is recognised immediately with the rate regulated asset/liability unwind being recognised via increased/reduced regulatory depreciation (RCV run-off). |
| This results in both a deferral of recognition and a smoothing of the inflation return in future revenues. | Inflation is immediately recognised and there is no smoothing of the return over future periods. | |
| Difference in regulatory depreciation: Regulatory depreciation progressively increases compared to accounting depreciation due to the increased/reduced regulatory depreciation (RCV run-off) from the inflation return added to the RCV. | The difference between regulatory depreciation (RCV run-off) and the PPE accounting depreciation principally represents the unwind of the inflation from the RCV. | The difference between regulatory depreciation (RCV run-off) and the PPE accounting depreciation principally represents the unwind of the inflation from the RCV. |
| There may also be a difference in the natural rate at which the RCV is depreciated into revenues and the rate at which PPE is depreciated in the income statement. | This is recognised in allowed revenue over the long term on a smoothed basis. | This represents the unwind of the regulatory asset as customers pay the inflation return in the future. |
| Any difference in the natural rate of depreciation (based on a different view of overall asset lives) is not adjusted. | Any difference in the natural rate of depreciation (based on a different view of overall asset lives) is adjusted. | |
| Incentive mechanisms applied to RCV: Some adjustments arising from Incentive Mechanisms (such as totex) have a component that is adjusted against the RCV rather than allowed revenue. This value is then recovered over the long term through increased/reduced RCV run-off in future periods. | Any penalty incurred or reward earned would not be recognised in the period it accrued. | Any penalty incurred or reward earned would be recognised in the period it accrued. |
| This results in both a deferral of recognition and a smoothing of the penalty/reward in future revenues. | The penalty/reward is immediately recognised and there is no smoothing of the return over future periods. | |
| Regulatory acceleration of regulatory depreciation (RCV run off): Regulators utilise regulatory depreciation (RCV run-off) as a tool to manage income statement metrics by creating a higher reported profit in the case of acceleration of regulatory depreciation (RCV run-off). | Acceleration of regulatory depreciation (RCV run-off) would result in higher reported profits in the period of acceleration to the detriment of lower reported profits in future periods. | The acceleration of regulatory depreciation (RCV run-off) would reduce Allowed Revenue in the period. There would be recognition of a regulatory liability. This regulatory liability would unwind in future periods when Allowed Revenue is lower, offsetting the lower reported profits. |
| They may do this to manage financeability issues rather than increasing the real WACC. This is because regulatory depreciation (RCV run-off) is a cashflow timing rather than a value issue. | ||
| Regulatory deferral of regulatory depreciation (RCV run off): Regulators also utilise regulatory depreciation (RCV run-off) as a tool to manage bill impacts for customers by creating a lower billed revenue in the case of deferral of regulatory depreciation (RCV run-off). | Deferral of regulatory depreciation (RCV run-off) would result in lower reported profits in the period of deferral to the benefit of higher reported profits in future periods. | The deferral of regulatory depreciation (RCV run-off) would increase Allowed Revenue in the period. There would be recognition of a regulatory asset. This regulatory asset would unwind in future periods when Allowed Revenue is higher, offsetting the higher reported profits. |
| They may do this to manage challenging bill impacts for customers, deferring the payment for the goods or services provided into the future. | ||
| Real growth in capex: Significant growth in capex driving a significant real growth in the RCV, such as that currently being driven by climate change mitigation and adaptation, will have a leveraging effect on issues identified above in relation to inflation and difference in regulatory depreciation. | ||
| Real decline in capex: Likewise a significant reduction in capex driving a significant real reduction in the RCV, such as when climate change expenditure settles to become steady state maintenance, will have a de-leveraging effect on issues identified above in relation to inflation and difference in regulatory depreciation. |
Appendix C: UKEB top-down approach—Unit of account
Purpose
1The purpose of this paper is to facilitate the discussion of the unit of account concept when looking at timing differences that are reflected in the regulatory capital base (RCB). This section sets out:
- The proposals in the ED.
- The IASB's tentative decisions, including feedback received.
- Applying the IASB's tentative decisions in practice using as example an Ofwat-regulated entity.
- The unit of account in existing IFRS Standards, including the Conceptual Framework and analogies in IFRS Standards that can potentially be applied when considering the appropriate unit of account for timing differences in RCB in entities that do not have a direct relationship.
2The ED covers unit of account in paragraph 24:
"An entity shall account for the right or obligation arising from each individual difference in timing described in paragraph 12(a) as a separate unit of account. However, if rights, obligations, or rights and obligations arising from the same regulatory agreement have similar expiry patterns and are subject to similar risks, they may be treated as arising from the same individual difference in timing.”
Paragraph 12(a) says:
"differences in timing arise because the regulatory agreement includes part of that total allowed compensation in determining the regulated rates for goods or services supplied in a different period (past or future)"
Subsequent IASB tentative decisions
3Relating to the unit of account, the IASB (at its December 2023 meeting) agreed to:
"clarify that the unit of account is the right or obligation arising from a difference in timing or from a group of differences in timing. The differences in timing included in that group would:
- be created by the same regulatory agreement;
- have similar expiry patterns; and
- be subject to similar risks." 1"
4The description in paragraph 21 of Agenda Paper 9A 2 of its December 2023 meeting says that:
"When a regulatory agreement groups differences in timing and considers them to be a single adjustment to the future regulated rate [...], those differences in timing would have the same expiry pattern and be subject to the same risks. This would be an example of a right or obligation arising from a group of differences in timing. We think paragraph 24 of the Exposure Draft would capture this example, but that paragraph could be redrafted for greater clarity and the final Standard could include such an example."
5The above paragraph means that grouping of timing differences is permitted when they are considered by the regulator as a single adjustment to the future regulated rate. This is because the total adjustment would have the same expiry pattern and be subject to the same risks.
Applying the IASB's tentative decisions in practice
6For UK regulatory agreements, the application of paragraph 21 of Agenda Paper 9A 3 of its December 2023 meeting seems to imply that timing differences can be grouped. However, differences in timing that are added to/deducted from RCB in entities with a no direct relationship is not permitted. The differences in timing generally relate to additions and inflation.
7These timing differences in RCB represent the difference in revenue that conceptually should be able to be generated by an entity's PPE and the revenue that can be generated from its RCB.
8Ofwat views RCV (RCB) as a homogenous regulatory concept and represents one regulatory asset (the present value of future revenue) and as such is not separable or divisible. Ofwat monitors and approves four business lines, effectively four RCVs, within the regulatory agreement, as follows:
- water;
- waste water;
- bioresources; and
- water resources.
9Ofwat do not have a lower level of monitoring and approval. Each of these lines of business will generally have similar expiry patterns and similar risks. The unit of account for the timing differences in RCB is therefore the total timing difference of consumption of the RCB compared to the PPE.
10The timing differences are therefore tracked and monitored. This provides relevant information for financial reporting, can be reliably measured on a cost-effective basis, and gives a faithful representation of the economic position of the entity.
Conclusion
11In considering the IASB's tentative decisions relating to other aspects of the RRA project with timing differences that are reflected in RCB in entities that have no direct relationship, it seems that there is precedent that a higher unit of account is possible. This would be a better reflection of the economics of these rate-regulated entities.
Questions for RRA TAG members
1Do TAG members consider that they can track and monitor the timing differences reflected in RCB by line of business?
Annex A: Unit of account in Conceptual Framework
A1The Conceptual Framework states that a unit of account is selected to provide useful information to users of financial statements. The Conceptual Framework also states that treating a group of rights and obligations as a single unit of account may provide more relevant information than treating each right and obligation as a separate unit of account if, for example, those rights and obligations:
- cannot or are unlikely to be the subject of separate transactions;
- cannot or are unlikely to expire in different patterns;
- have similar economic characteristics and risks and hence are likely to have similar implications for the prospects for future net cash inflows to the entity or net cash outflows from the entity; or
- are used together in the business activities conducted by an entity to produce cash flows and are measured by reference to estimates of their interdependent future cash flows.
Application to RRA
A2It seems clear that the description in paragraph 21 of Agenda Paper 9A 4 of its December 2023 meeting (copied above) that grouping of timing differences is permitted when they are taken by the regulator as a single adjustment to the future regulated rate. This is because the total adjustment would have the same expiry pattern and be subject to the same risks. This is consistent with the Conceptual Framework.
Appendix D: UKEB top-down approach—Inflation
Introduction
1The UKEB is concerned that the IASB's proposed approach (see paper 2A) does not fully reflect the underlying economics of those entities that do not have a direct relationship between PPE and RCB. The financial reporting may under- or over-estimate the returns being earned by a UK entity using a real interest rate model and so not provide relevant information. This reduces comparability between entities using different interest rate model (real and nominal). The IASB's proposed approach means that for:
- an entity with a direct relationship between its PPE and RCB and using a nominal interest rate model: the nominal interest amount includes inflation. This amount is added to Allowed Revenue and consequently is recognised in the period.
- entities with no direct relationship between PPE and RCB and using a real interest rate model: the real interest amount does not include inflation. This amount is added is added to Allowed Revenue and consequently is recognised in the period. However, the amount for inflation is recognised directly in RCB. Because of the no direct relationship between PPE and RCB, it is not permitted to be recognised.
2It is acknowledged that there may be entities that have a no direct relationship between PPE and RCB that use a nominal interest rate model. This combination of factors is outside the scope of this paper because our understanding is that UK entities use a real interest rate model.
3For the UK water industry, the inflation is added to RCB in the year that the entity is supplying its goods and services so it is a timing difference.
Purpose
4The purpose of this paper is to illustrate:
- Business model of a rate-regulated business operating under a nominal interest rate model using a simplified example.
- Business model of a rate-regulated business operating under a real interest rate model using a simplified example.
5The examples reflect the impact of the different interest rate models on the income statement, statement of financial position and cashflows.
ED proposals
6The ED does not permit inflation to be recognised irrespective of whether the entity has a direct (no direct) relationship between its PPE and RCB. The conclusion in paragraph 48 of IASB agenda paper AP9A December 2022 states 1:
"We think an entity's right to add an amount relating to the inflation adjustment to the regulatory capital base to regulated rates charged in the future would give rise to a regulatory asset if that right is enforceable [...]. We think that, however, the costs arising from the recognition of that asset would outweigh the benefits of the information provided for users [...]."
7This comment does not recognise that the approach taken to recognising inflation is generally dependent on whether an entity has a direct or no direct relationship between its PPE and RCB. Generally, entities with:
- A direct relationship between PPE and RCB use a nominal approach to recognising interest.
- A no direct relationship between PPE and RCB use a real approach to recognising interest.
8On the face of it, the proposed requirements in the ED appear to demonstrate consistency and parity in the approach to inflation taken by the IASB.
Explanation of nominal versus real interest rate models
9Investopedia explains that the difference between these two approaches to interest can be described as follows:
"Interest rates can be expressed in nominal or real terms. A nominal interest rate equals the real interest rate plus a projected rate of inflation. A real interest rate reflects the true cost of funds to the borrower and the real yield to the lender or to an investor. 2"
This is illustrated by the Fisher equation 3 as:
1+ Nominal Interest Rate = (1 + Real Interest Rate) X (1 + Inflation)
10Where an entity has a direct relationship between PPE and RCB and uses a nominal interest rate approach: This means that the nominal interest rate amount includes a real interest rate (for the return on capital) plus a projected rate of inflation. The nominal interest rate amount is recognised as the return on RCB and included in allowed revenue, in the same year as the goods or services are supplied. This effectively means that the projected rate of inflation is recognised as part of allowed revenues, under the nominal interest rate approach, in the same year as the goods or services are supplied.
11Where an entity has a no direct relationship between PPE and RCB and uses a real interest rate approach: This means that a real interest rate (for the return on capital) is recognised as the return on RCB and included in allowed revenue, in the same year as the goods or services are supplied. However, the projected rate of inflation is recognised directly in RCB. Because there is no direct relationship between PPE and RCB, that amount is not permitted to be recognised as a regulatory asset under the proposed requirements (in the example below 2%). The inflation amount in RCB is recognised in allowed revenue over the period in which the RCB is recovered, e.g. over 25 years.
12This effectively means that the projected rate of inflation is recognised as allowed revenue, as a part of the nominal interest rate model where an entity uses the nominal model and has a direct relationship between PPE and RCB. Whereas, entities that use a real interest rate model and have no direct relationship between PPE and RCB, are not permitted to recognise the inflation allowance as it is included with the RCB rather than revenue. The table below illustrates the concept.
| PPE and RCB relationship | Direct relationship | No direct relationship | No direct relationship | ||
|---|---|---|---|---|---|
| Interest approach | Nominal | Real return on capital | Inflation | ||
| % | 5.06% | = | (1 +3%) | X | (1 + 2%) |
| Regulatory adjustments | Recognised as allowed revenue for the year | Recognised as allowed revenue for the year | Recognised in RCB | ||
| Accounting adjustments | Recognised in IFRS 15 revenue for the year | Recognised in IFRS 15 revenue for the year | No recognition of regulatory asset |
13The table above uses a projected rate of inflation of 2%. It is worth noting that the UK has been experiencing high inflation over the last few years. For example, inflation as at 31 March 2023 was 10.9%. This would have quite a significant effect in the financial statements.
14From the above discussion it seems that the difference between the nominal interest rate model and the real interest rate model does not appear to provide consistency of approach for the recognition of inflation in the financial statements.
Background to the existing business model examples
15Generally, a nominal business model is applied to cost-based rate-regulated businesses such as those operating in North America. This business model applies a nominal cost of capital to derive the return on capital component of the allowed revenue requirement.
16In contrast, a real business model is applied to incentive-based rate-regulated businesses such as those operating in the UK and elsewhere in the world. This business model applies a real cost of capital to derive the return on capital component of the allowed revenue requirement with the inflation return being applied as an uplift to the regulatory capital base (RCB). This inflation return is received as a cashflow in subsequent periods as the RCB is depreciated.
17There are two key concepts to the base rate-regulated business model. These are the RCB and the Allowed Revenue Requirement.
Regulatory Capital Base (RCB)
18The RCB represents the present value of the future revenues that the business expects to earn. In concept it is similar to the accounting model for property plant and equipment (PPE) with the nominal model of RCB being analogous to a historic cost model for PPE. The real model of RCB is analogous to a current cost model for PPE.
19In cost-based rate-regulated businesses there is generally a direct link between the RCB and the PPE given the broad alignment of the RCB and PPE models and because there are few other adjustments impacting the RCB.
20In incentive-based regulated businesses there is no direct link between the RCB and the PPE as the RCB and PPE models are fundamentally different. The RCB is maintained on a real (or current cost basis) and the PPE using a historic cost model. In addition, there are other adjustments impacting the RCB where the regulator more generally may choose to use the RCB to defer and/or accelerate cashflows based on the outcomes they are seeking to achieve.
21Under an incentive-based rate-regulated business model therefore, while the RCB and PPE are likely to be broadly aligned, it is not feasible in practice to reconcile the them on a “bottom-up” basis.
22The RCB represents the present value of future revenues the business expects to earn. Investments are added to the RCB and depreciation of the RCB results in the economic return of capital. In a real model, the RCB is also uplifted for inflation.
Allowed revenue
23The allowed revenue comprises four principal building blocks, namely:
- Return on capital: calculated by applying the cost of capital (either real or nominal) to the RCB (either real or nominal).
- Return of capital: the amount of regulatory economic depreciation consumed in the period from the RCB.
- Operating expenditure (Opex): is the in-year short-term costs that are funded immediately through customer bills.
- Tax: the cash tax amount that is expected to be incurred in the year is also funded immediately through customer bills or other items affecting regulatory rates on a cash basis.
24There are also other adjustment mechanisms (e.g. incentive mechanisms) which are out of scope of this paper.
Simplified illustrative examples
25To illustrate the two alternative basic models, below is a simple example of a rate-regulated business.
26The simplified fact pattern applied for the example comprises:
- A single asset business for the whole lifecycle.
- RRA business with one asset at T0 of £100m.
- Asset life is ten years.
- The regulatory economic depreciation is recovered over the asset life.
- No additional asset investments.
- The real cost of capital (WACC) is 3.0%.
- The inflation rate is 2.0%.
- The resulting nominal cost of capital (WACC) is 5.06%.
- Operating costs in T0 are £5m p.a. and these increase with inflation.
- Cash tax rate is assumed to be zero, so no tax considerations.
- Actual outturn costs of the business are as expected.
- Inflation is assumed to out-turn at 2% throughout period.
- Consider as one regulatory period for the whole 10-year life of the asset.
- Assume return on capital is earned on the opening RCB balance.
- Assume all cashflows occur at end of each year.
- Assume business is entirely debt funded at a fixed nominal rate.
- Assume cash/debt balances earn/incur the WACC interest rate of 5.06%.
Existing IASB nominal model example
27Figure 1 below illustrates the existing IASB nominal model example.
| REGULATORY MODEL BUILDING BLOCKS | 20X0 £m | 20X1 £m | 20X2 £m | 20X3 £m | 20X4 £m | 20X5 £m | 20X6 £m | 20X7 £m | 20X8 £m | 20X9 £m | 20Y0 £m |
|---|---|---|---|---|---|---|---|---|---|---|---|
| RAB | |||||||||||
| Open balance | 100.000 | 90.000 | 80.000 | 70.000 | 60.000 | 50.000 | 40.000 | 30.000 | 20.000 | 10.000 | |
| Depreciation | (10.000) | (10.000) | (10.000) | (10.000) | (10.000) | (10.000) | (10.000) | (10.000) | (10.000) | (10.000) | |
| Close balance | 100.000 | 90.000 | 80.000 | 70.000 | 60.000 | 50.000 | 40.000 | 30.000 | 20.000 | 10.000 | 0.000 |
| Allowed Revenue | |||||||||||
| Return on capital (WACC x RAB) | 5.060 | 4.554 | 4.048 | 3.542 | 3.036 | 2.530 | 2.024 | 1.518 | 1.012 | 0.506 | |
| Return of capital (depreciation) | 10.000 | 10.000 | 10.000 | 10.000 | 10.000 | 10.000 | 10.000 | 10.000 | 10.000 | 10.000 | |
| Opex allowance | 5.000 | 5.100 | 5.202 | 5.306 | 5.412 | 5.520 | 5.631 | 5.743 | 5.858 | 5.975 | 6.095 |
| Revenue | 20.160 | 19.756 | 19.354 | 18.954 | 18.556 | 18.161 | 17.767 | 17.376 | 16.987 | 16.601 | |
| DCF | 0.952 | 0.906 | 0.862 | 0.821 | 0.781 | 0.744 | 0.708 | 0.674 | 0.641 | 0.610 | |
| Discounted Revenue | 19.189 | 17.899 | 16.690 | 15.558 | 14.498 | 13.506 | 12.577 | 11.707 | 10.894 | 10.134 | |
| PRIMARY FINANCIAL STATEMENTS | |||||||||||
| Income Statement | 20X0 £m | 20X1 £m | 20X2 £m | 20X3 £m | 20X4 £m | 20X5 £m | 20X6 £m | 20X7 £m | 20X8 £m | 20X9 £m | 20Y0 £m |
| Revenue | 20.160 | 19.756 | 19.354 | 18.954 | 18.556 | 18.161 | 17.767 | 17.376 | 16.987 | 16.601 | |
| Operating costs | (5.100) | (5.202) | (5.306) | (5.412) | (5.520) | (5.631) | (5.743) | (5.858) | (5.975) | (6.095) | |
| Depreciation | (10.000) | (10.000) | (10.000) | (10.000) | (10.000) | (10.000) | (10.000) | (10.000) | (10.000) | (10.000) | |
| Operating profit | 5.060 | 4.554 | 4.048 | 3.542 | 3.036 | 2.530 | 2.024 | 1.518 | 1.012 | 0.506 | |
| Net finance income/(expense) | (5.060) | (4.554) | (4.048) | (3.542) | (3.036) | (2.530) | (2.024) | (1.518) | (1.012) | (0.506) | |
| Retained profit | 0.000 | 0.000 | 0.000 | 0.000 | 0.000 | 0.000 | 0.000 | 0.000 | 0.000 | 0.000 | |
| Statement of Financial Position | |||||||||||
| Property plant & equipment | 100.000 | 90.000 | 80.000 | 70.000 | 60.000 | 50.000 | 40.000 | 30.000 | 20.000 | 10.000 | 0.000 |
| Cash/(Debt) | (100.000) | (90.000) | (80.000) | (70.000) | (60.000) | (50.000) | (40.000) | (30.000) | (20.000) | (10.000) | 0.000 |
| Net assets | 0.000 | 0.000 | 0.000 | 0.000 | 0.000 | 0.000 | 0.000 | 0.000 | 0.000 | 0.000 | 0.000 |
| Cashflow | |||||||||||
| Operating profit | 5.060 | 4.554 | 4.048 | 3.542 | 3.036 | 2.530 | 2.024 | 1.518 | 1.012 | 0.506 | |
| Add: Depreciation | 10.000 | 10.000 | 10.000 | 10.000 | 10.000 | 10.000 | 10.000 | 10.000 | 10.000 | 10.000 | |
| Add: Net finance income/(expense) | (5.060) | (4.554) | (4.048) | (3.542) | (3.036) | (2.530) | (2.024) | (1.518) | (1.012) | (0.506) | |
| Net Cashflow | 10.000 | 10.000 | 10.000 | 10.000 | 10.000 | 10.000 | 10.000 | 10.000 | 10.000 | 10.000 |
28The upper section of Figure 1 summarises the regulatory model building blocks for RCB (called RAB (regulatory asset base in Figure 1) which is called RCB in the ED) and Allowed Revenue.
29The RCB commences the period at £100m and depreciates evenly over the 10-year life of the asset such that the RCB ends the period at £nil. As this is a nominal model there is no inflation return applied to the RCB as the inflation return is included in the nominal WACC in allowed revenues.
30The Allowed Revenue comprises:
- The return on capital: This is the WACC of 5.06% applied to the opening balance of the RCB.
- The return of capital: This is the economic depreciation being the rate at which the regulator allows recovery of the deferred revenue in the RCB.
- The operating cost allowance: This is the economic cost allowance for operating the asset in the period.
31For comparison purposes the present value of the Allowed Revenue is also illustrated across the ten-year period.
32The lower section of Figure 1 summarises the primary financial statements under current IFRS reporting:
- The Income Statement comprises revenue billed to customers in the period, the operating costs incurred and the historic cost accounting depreciation. This leaves the operating profit comprising the nominal return on capital earned in the period. The net finance expense represents the financing impact of the net debt balance which mirrors the return earned due to the assumptions. As such retained profit is zero.
- The Statement of Financial Position reflects the unwind of the PPE and debt balance.
- The Cashflow reflects the operating profit, adjusted for depreciation and the financing charge on the debt balance.
Existing UK real model example
33Figure 2 below sets out the existing UK real model example.
| REGULATORY MODEL BUILDING BLOCKS | 20X0 £m | 20X1 £m | 20X2 £m | 20X3 £m | 20X4 £m | 20X5 £m | 20X6 £m | 20X7 £m | 20X8 £m | 20X9 £m | 20Y0 £m |
|---|---|---|---|---|---|---|---|---|---|---|---|
| RAB | |||||||||||
| Open balance | 100.000 | 91.800 | 83.232 | 74.285 | 64.946 | 55.204 | 45.046 | 34.461 | 23.433 | 11.951 | |
| Inflation | 2.000 | 1.836 | 1.665 | 1.486 | 1.299 | 1.104 | 0.901 | 0.689 | 0.469 | 0.239 | |
| Inflated open balance | 102.000 | 93.636 | 84.897 | 75.770 | 66.245 | 56.308 | 45.947 | 35.150 | 23.902 | 12.190 | |
| Depreciation | (10.200) | (10.404) | (10.612) | (10.824) | (11.041) | (11.262) | (11.487) | (11.717) | (11.951) | (12.190) | |
| Close balance | 100.000 | 91.800 | 83.232 | 74.285 | 64.946 | 55.204 | 45.046 | 34.461 | 23.433 | 11.951 | 0.000 |
| Allowed Revenue | |||||||||||
| Return on capital (WACC x RAB) | 3.060 | 2.809 | 2.547 | 2.273 | 1.987 | 1.689 | 1.378 | 1.054 | 0.717 | 0.366 | |
| Return of capital (depreciation) | 10.200 | 10.404 | 10.612 | 10.824 | 11.041 | 11.262 | 11.487 | 11.717 | 11.951 | 12.190 | |
| Opex allowance | 5.000 | 5.100 | 5.202 | 5.306 | 5.412 | 5.520 | 5.631 | 5.743 | 5.858 | 5.975 | 6.095 |
| Revenue | 18.360 | 18.415 | 18.465 | 18.510 | 18.549 | 18.582 | 18.609 | 18.629 | 18.643 | 18.651 | |
| DCF | 0.952 | 0.906 | 0.862 | 0.821 | 0.781 | 0.744 | 0.708 | 0.674 | 0.641 | 0.610 | |
| Discounted Revenue | 17.476 | 16.684 | 15.923 | 15.193 | 14.492 | 13.818 | 13.172 | 12.552 | 11.956 | 11.385 | |
| PRIMARY FINANCIAL STATEMENTS | |||||||||||
| Income Statement | 20X0 £m | 20X1 £m | 20X2 £m | 20X3 £m | 20X4 £m | 20X5 £m | 20X6 £m | 20X7 £m | 20X8 £m | 20X9 £m | 20Y0 £m |
| Revenue | 18.360 | 18.415 | 18.465 | 18.510 | 18.549 | 18.582 | 18.609 | 18.629 | 18.643 | 18.651 | |
| Operating costs | (5.100) | (5.202) | (5.306) | (5.412) | (5.520) | (5.631) | (5.743) | (5.858) | (5.975) | (6.095) | |
| Depreciation | (10.000) | (10.000) | (10.000) | (10.000) | (10.000) | (10.000) | (10.000) | (10.000) | (10.000) | (10.000) | |
| Operating profit | 3.260 | 3.213 | 3.159 | 3.097 | 3.028 | 2.951 | 2.865 | 2.771 | 2.668 | 2.556 | |
| Net finance income/(expense) | (5.060) | (4.645) | (4.212) | (3.759) | (3.286) | (2.793) | (2.279) | (1.744) | (1.186) | (0.605) | |
| Retained profit | (1.800) | (1.432) | (1.053) | (0.661) | (0.258) | 0.158 | 0.586 | 1.027 | 1.482 | 1.951 | |
| Statement of Financial Position | |||||||||||
| Property plant & equipment | 100.000 | 90.000 | 80.000 | 70.000 | 60.000 | 50.000 | 40.000 | 30.000 | 20.000 | 10.000 | 0.000 |
| Cash/(Debt) | (100.000) | (91.800) | (83.232) | (74.285) | (64.946) | (55.204) | (45.046) | (34.461) | (23.433) | (11.951) | 0.000 |
| Net assets | 0.000 | (1.800) | (3.232) | (4.285) | (4.946) | (5.204) | (5.046) | (4.461) | (3.433) | (1.951) | 0.000 |
| Cashflow | |||||||||||
| Operating profit | 3.260 | 3.213 | 3.159 | 3.097 | 3.028 | 2.951 | 2.865 | 2.771 | 2.668 | 2.556 | |
| Add: Depreciation | 10.000 | 10.000 | 10.000 | 10.000 | 10.000 | 10.000 | 10.000 | 10.000 | 10.000 | 10.000 | |
| Add: Net finance income/(expense) | (5.060) | (4.645) | (4.212) | (3.759) | (3.286) | (2.793) | (2.279) | (1.744) | (1.186) | (0.605) | |
| Net Cashflow | 8.200 | 8.568 | 8.947 | 9.339 | 9.742 | 10.158 | 10.586 | 11.027 | 11.482 | 11.951 |
34As with the nominal model, the upper section of Figure 2 summarises the regulatory model building blocks for RCB and Allowed Revenue.
35Again, the RCB commences the period at £100m and depreciates over the 10-year life of the asset such that the RCB ends the period at £nil. However, as this is a real model the inflation return is added to the RCB rather than being part of the in period Allowed Revenue. This means the inflation returned earned in a period is recovered through future cashflows as the inflated RCB is depreciated over time.
36The Allowed Revenue is calculated in a similar way to the nominal model and comprises:
- The return on capital: This is the WACC of 3.00% being the real WACC applied to the opening balance of the RCB. As such the return on capital in a real model is lower than in a nominal model.
- The return of capital: This is the economic depreciation being the rate at which the regulator allows recovery of the deferred revenue in the RCB. This differs from the nominal model in two respects. Firstly, the amount of economic depreciation will grow over time reflecting the inflating RCB balance and secondly, the amount of depreciation will be higher than under the nominal model reflecting the cash recovery of the inflation return.
- The operating cost allowance: This is the economic cost allowance for operating the asset in the period.
37Again, for comparison purposes the present value of the Allowed Revenue is also illustrated across the 10-year period.
38Adding the Opex allowance gives the total Allowed Revenue recovered from customers. This is higher under the real model due to the extra financing costs incurred because the customer payment profile under the real model lags that under the nominal model. As expected, the present value of the Allowed Revenue is the same under both models.
39The lower section of Figure 2 summarises the primary financial statements under current IFRS reporting:
- The Income Statement comprises revenue billed to customers in the period, the operating costs incurred and the historic cost accounting depreciation. This leaves the operating profit comprising predominately the real return on capital initially, which progressively switches over the life of the asset to being the excess return of capital.
- The net finance expense represents the financing impact of the net debt balance. This all results in a retained profit that is initially a loss position, but which reverts to a profit over time.
- The Statement of Financial Position reflects the unwind of the PPE and debt balance.
- The Cashflow reflects the operating profit, adjusted for depreciation and the financing charge on the debt balance.
Comparing the existing models
40Comparing the Allowed Revenue across the 10-year period one can observe:
| Nominal model (£m) | Real model (£m) | |
|---|---|---|
| Return on capital | 27.83 | 17.88 |
| Return of capital | 100.00 | 111.68 |
| Allowed Revenue | 183.67 | 185.41 |
| PV of Allowed Revenue | 142.65 | 142.65 |
41The return on capital is higher under the nominal model reflecting the inflation return being recovered immediately through the Allowed Revenue in each period. Whereas the return of capital is higher under the real model as the inflation return is recovered through the economic depreciation of the RCB.
42Adding the Opex allowance gives the total Allowed Revenue recovered from customers. This is higher under the real model due to the extra financing costs incurred because the customer payment profile under the real model lags that under the nominal model. As expected, the present value of the Allowed Revenue is the same under both models.
43The charts below summarise the operating profit and retained profit profiles for the two models as described above.
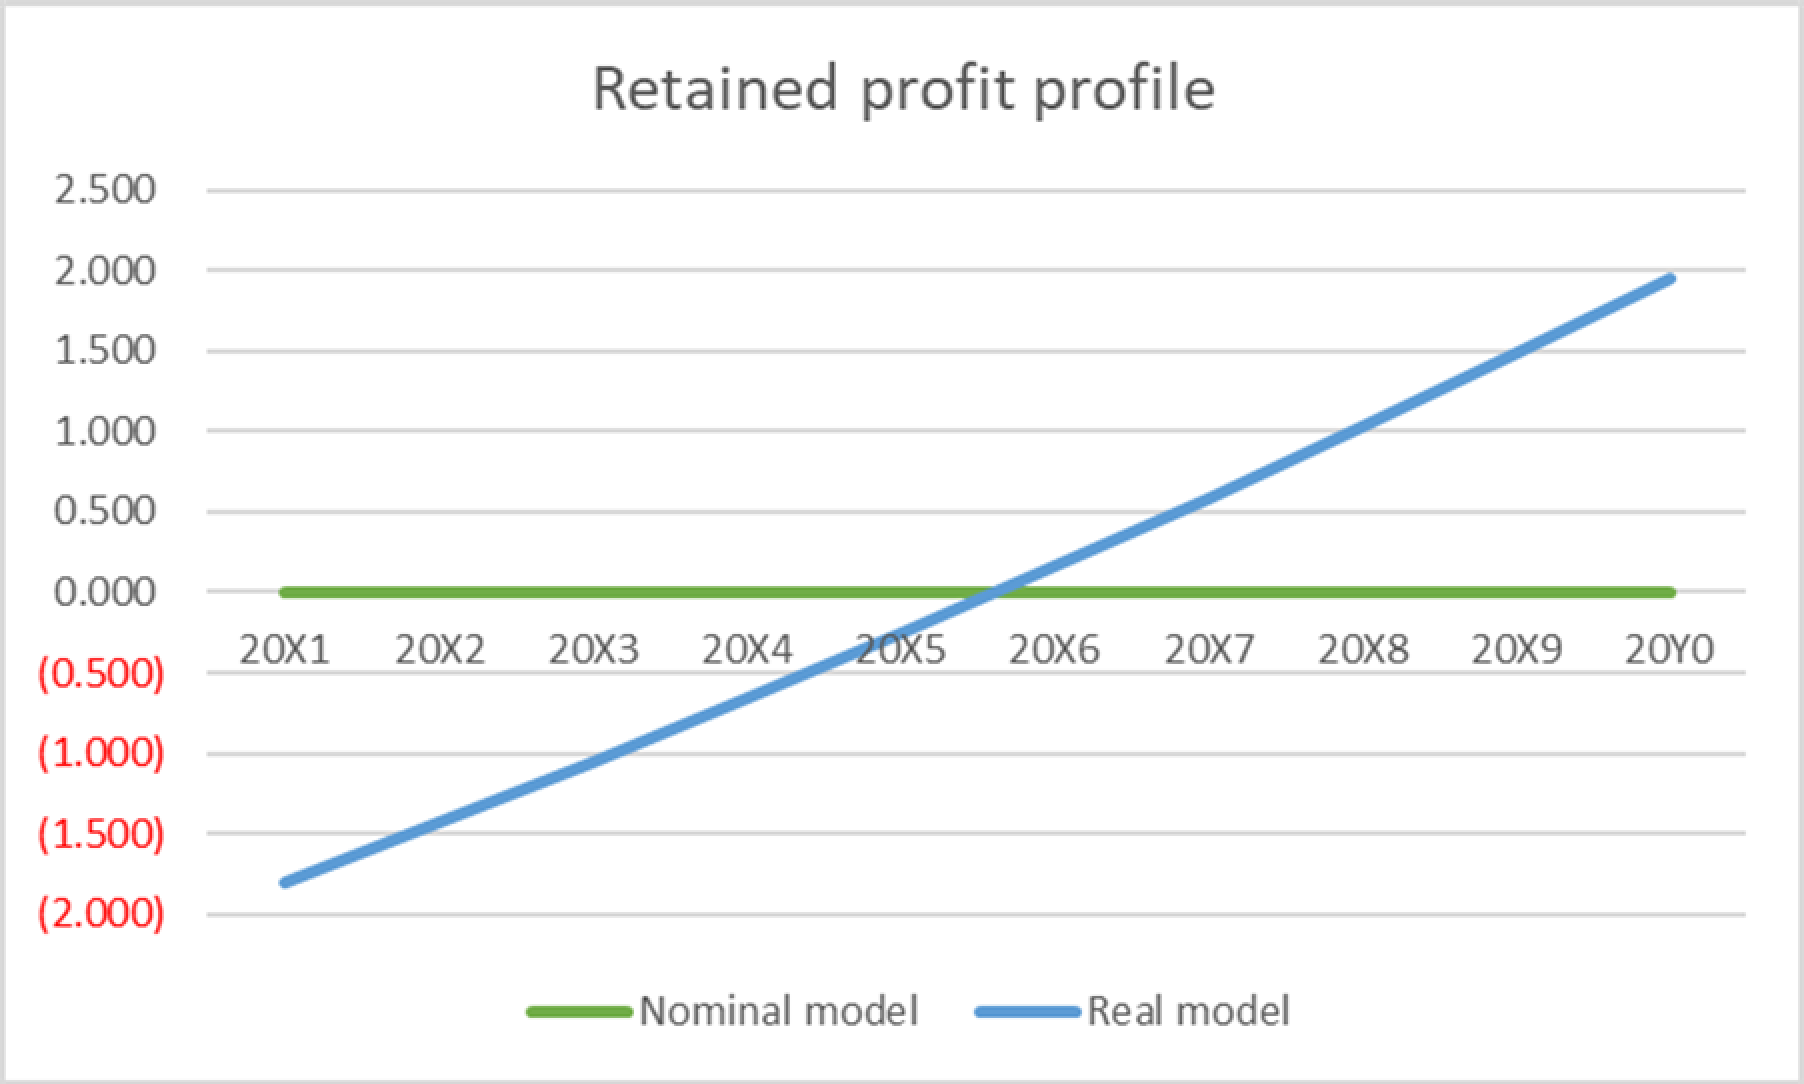
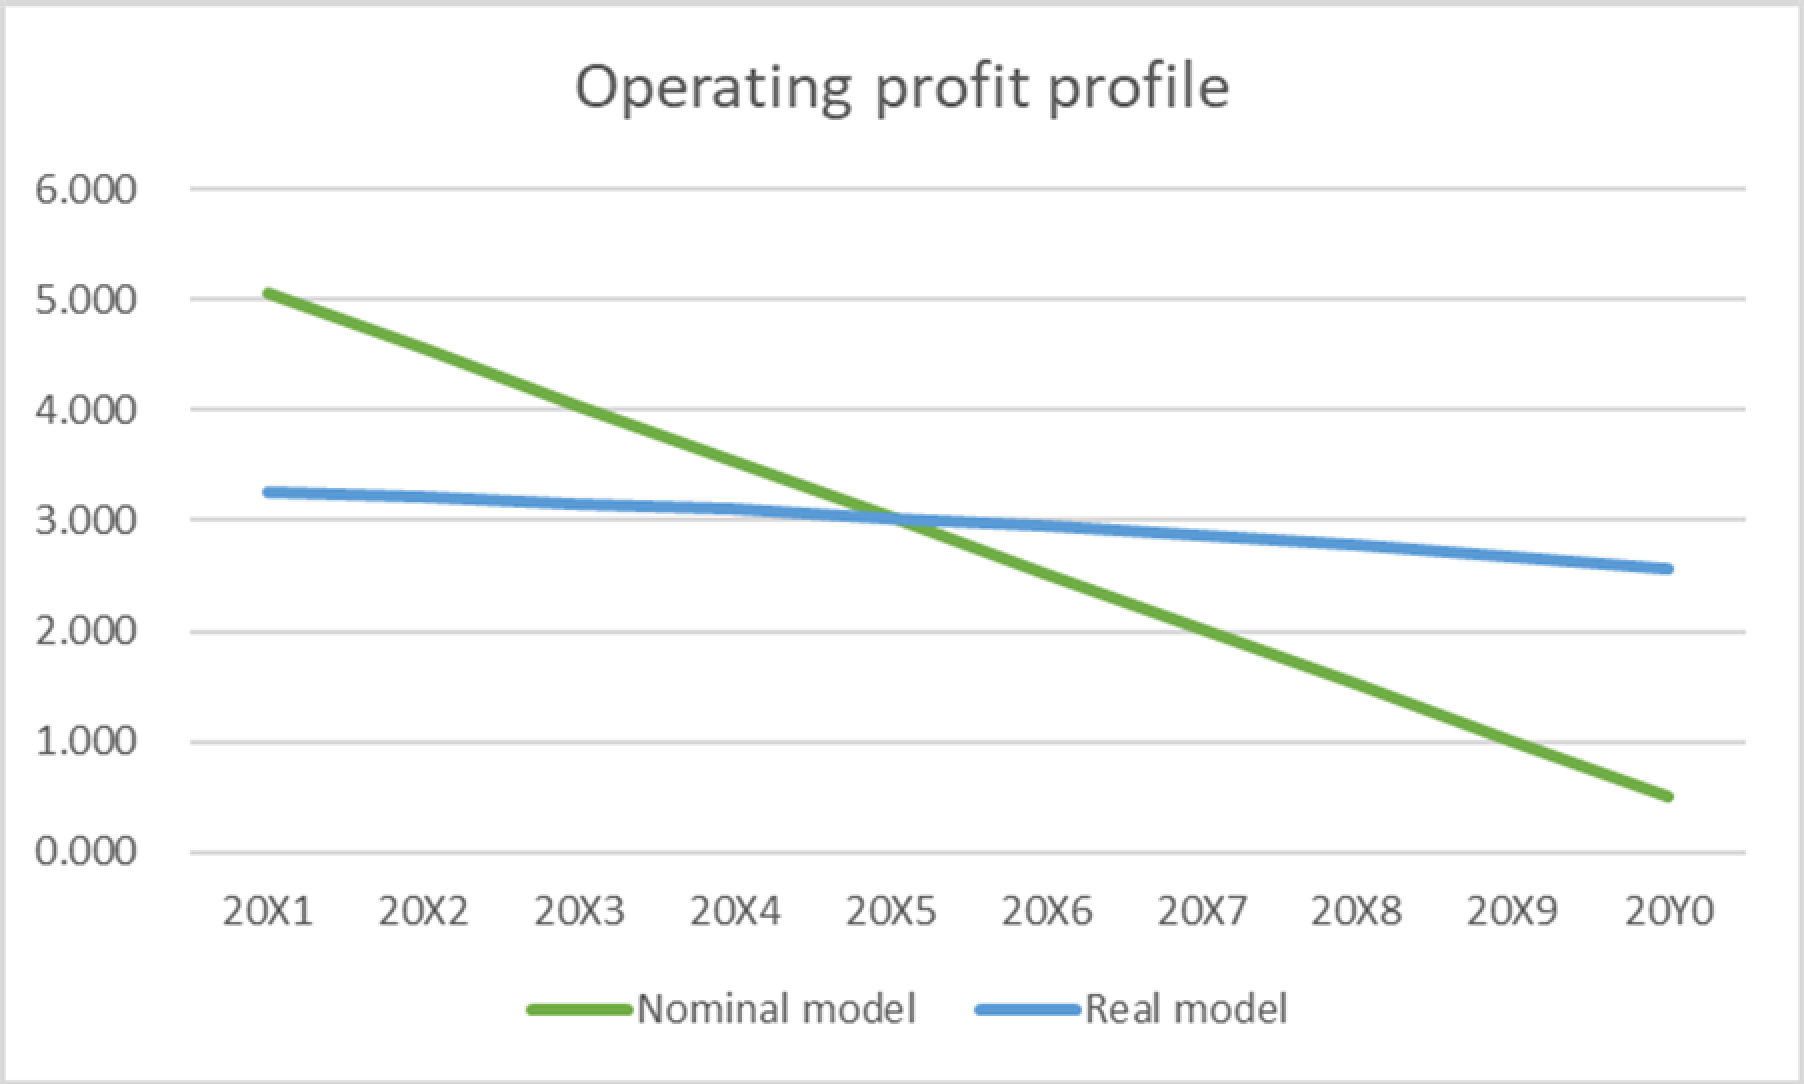
Questions for RRA TAG members
1Do TAG members use a real interest model?
2Do TAG members consider that the explanation of the differences between a nominal interest model and a real interest model is correct?
3Do TAG members consider that there are published documents that show the real return on capital and inflation amounts that could be used?
4Do TAG members consider that the simplified examples showing the IASB nominal interest rate model and the UK real interest rate model reflect how the business models for rate-regulated activities work?
Footnotes
-
https://www.ifrs.org/content/dam/ifrs/meetings/2022/december/iasb/ap9a-inflation.pdf ↩↩↩↩
-
https://www.investopedia.com/ask/answers/032515/what-difference-between-real-and-nominal-interest-rates.asp ↩↩↩
-
The Fisher equation is a concept in economics that describes the relationship between nominal and real interest rates under the effect of inflation. The equation states that the nominal interest rate is equal to the sum of the real interest rate plus inflation. Source: https://corporatefinanceinstitute.com/resources/economics/fisher-equation/ ↩↩↩
-
IASB Agenda Paper 9B September 2023: https://www.ifrs.org/content/dam/ifrs/meetings/2023/september/iasb/ap9b-the-direct-no-direct-relationship-concept-report-on-findings-from-the-survey.pdf ↩