7 Intangibles quantitative research Project update
Project Type: Research Project Project Scope: Significant
This paper provides an update to the Board on the UKEB's second intangibles research project—a Quantitative Research Report on Intangibles and includes some preliminary findings from that research. This report complements the first report of this research project—a Qualitative Research Report on Intangibles, and adds to the UKEB's evidence base on the accounting for intangibles.
Summary of the Issue
The Project Initiation Plan (PIP) for the intangibles research project, approved at the April 2022 UKEB meeting1, indicated that the UKEB intended to produce three distinct reports on accounting for intangibles in the UK.
- The first report, summarising the qualitative research focused on stakeholders' views on the accounting for intangibles is in the process of being finalised.
- The second report, discussed in this paper is well underway and explores the accounting for intangibles quantitatively.
- The final report, which is in the preliminary phase, focuses on investor views on accounting for intangibles.
The three complementary reports will provide the UKEB with evidence about stakeholder views on the accounting for, and UK company reporting of, intangibles. The reports will support any future influencing work undertaken by the UKEB on an International Accounting Standards Board (IASB) intangibles project.
This paper is focused on the second report and sets out the research including the objective, structure, and timeline for the UKEB's Quantitative Research Project on Intangibles. This research project analyses economic and financial data, as well as financial statements of UK companies, to better understand the current reporting on intangibles in the UK. The paper also presents some high level and preliminary findings from the research (see Appendix A).
Decisions for the Board
The project PIP was previously approved by the Board. Therefore, the Board is asked for comment on the following aspects of the second report:
- research objective;
- report structure;
- preliminary findings; and
- timeline.
Recommendation
N/A
Appendices
Appendix A Examples of preliminary findings
Background
1In April 2022, the IASB confirmed that a research project on intangible items would be one of three projects to be added to its work plan, as a direct result of its third agenda consultation.
2The IASB staff paper2 stated (paragraph 35) that:
"[an intangibles] project should aim to comprehensively review IAS 38 [Intangible Assets]. Although developing enhanced disclosure requirements (such as disclosures about unrecognised intangible assets) would help to address user information needs, feedback indicates that other aspects of IAS 38 also should be reviewed. For example, respondents said that IAS 38 is an old Accounting Standard in need of modernising to reflect the increasing importance of intangible assets in today's business models."
3The IASB website currently states3 that, “This project will aim comprehensively to review the accounting requirements for intangible assets. Initial research will seek to identify the scope of the project and how best to stage work on this topic to deliver timely improvements to IFRS Accounting Standards.” To date no specific timeline is provided.
4In early 2022, the UKEB agreed to undertake a multi-output, proactive research project that would contribute to the international debate on intangible items. The research will focus on how the accounting for, and reporting of, intangible items could be improved to provide investors with more useful general purpose financial statements to help them make better informed decisions.
5The initial phase of the research is focused on understanding stakeholders' views (particularly investors) of the accounting for, as well as the current state of the reporting of, intangibles in the UK. This involves three reports:
- A qualitative report focused on stakeholder views about the accounting for intangible assets, supported by economic analysis and a review of key literature. This report is planned for publication in Q1 2023.
- A quantitative report examining the prevalence and economic relevance of intangible items for UK reporters, including an analysis of current practices among UK listed companies using IFRS Accounting Standards.
- An investor focussed report based on outreach with users (survey, interviews, roundtables). A preliminary structure for this report will be discussed with the Board in February 2023.
Quantitative Research Report: objective of the research
6The UKEB's qualitative report on intangibles is due to be published during Q1 2023. The report will set out the economic picture, namely the growth in size of intangibles on company and national levels, their impact on performance, productivity and profitability at an economic level, and stakeholder concerns with the current approach taken under IAS 38 Intangible Assets for reporting those assets. The report also sets out stakeholder view on possible ways in which the accounting for intangibles could be improved.
7Interviews with stakeholder identified the following concerns with IAS 38:
- It is an "old standard” that, in its current form, does not address the needs of the current business and economic environment;
- It has a high threshold for recognition of intangible assets, which may lead to under-reporting of these items on companies' balance sheets;
- It contains requirements for intangibles that lead to inconsistent accounting outcomes for similar assets when compared to other standards such as IFRS 3 Business Combinations; and
- The disclosures do not always lead to informative or useful information.
8The quantitative report builds on the qualitative report findings. In particular, this report aims to provide further quantitative information, including:
- Provide further and more granular evidence on the prevalence of intangibles among UK listed companies applying IFRS;
- Explore the relationship between intangible assets and companies' performance by reporting analyses conducted in-house on UK data; and
- Examine whether the main concerns identified by stakeholders in the qualitative report are supported by examination of UK companies' financial reports.
9To develop this evidence, the report will draw on a “three-tiered" analysis examining:
- financial data for UK listed companies;
- a sample of companies' annual reports; and
- a limited number of industries/companies based on the actual or expected prevalence of intangibles, or other relevant factors (such as the prevalence of mergers and acquisitions).
Quantitative Research Report: structure
10The report currently has the following structure:
- Executive Summary
- Introduction
- A quantitative analysis of UK listed companies' intangibles
- Methodology
- Prevalence of intangibles and goodwill
- Correlation between merger and acquisition activity and recognition of intangibles
- Estimating missing intangibles
- Relation between intangibles and companies' performance
- An in-depth analysis of reporting on intangibles by a sample of UK listed companies
- Methodology
- Amounts and types of intangibles reported by UK companies in their financial statements
- The nature and extent of disclosure by UK companies in their financial statements
- The relationship between management commentary on intangibles and the financial statements.
- Selected deep-dives on individual companies/industries
- Methodology
- Selected case studies
- Conclusions
Progress to date
11The Secretariat have commenced work on the data and financial statement analysis.
12The data analysis has focussed on providing granular evidence on the prevalence of intangible assets and goodwill reported on companies' financial statements. We are also examining:
- the correlation between merger and acquisition activity and intangible assets;
- estimates of "missing” intangibles among UK listed companies; and
- the possible relationship between intangible items and companies performance.
13The financial statement analysis undertaken so far has examined a sample of 40 FTSE 350 companies, representing varying sizes and industries (see Appendix A para A21). The focus has been on the value and types of intangible assets included in the financial statements and the related disclosures.
14Appendix A presents some preliminary findings. The analysis is ongoing and more comprehensive research will be presented to the Board in future meetings.
15As the work is explorative it is possible that conclusions or findings will change as further evidence come to light, and that other avenues of analysis may develop.
Question for the Board
1Do Board members have any comments on the:
- research objective;
- report structure; and
- preliminary findings?
Quantitative Research Report: Next steps
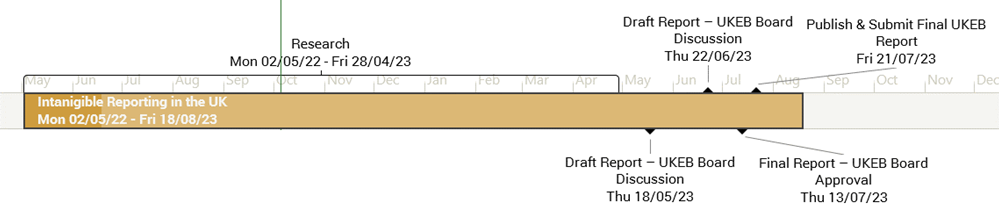
| Board Meeting | Milestones |
|---|---|
| January 2023 | Discussion of research project |
| February 2023 | |
| March 2023 | Discussion of analysis of company data |
| April 2023 | Case Studies of high intangible companies |
| [Discussion with Academic Advisory Group] | |
| May 2023 | Draft Report |
| June 2023 | Draft Report |
| Q3 | Final Report & Publicity Plan |
Question for the Board
2Do Board members have any comments on the next steps?
Appendix A: Examples of preliminary findings
A1This Appendix presents at a high level some preliminary findings of the research work currently underway. It is intended to give the Board a sense of the working being undertaken, rather than focussing on analysis and conclusions at this time. The analysis itself is ongoing and more comprehensive research will be presented to the Board in future meetings.
A2We expect the analysis and any conclusions to continue to evolve based on the results of future work and on Board's feedback in the coming months.
A quantitative analysis of intangibles among UK listed companies'
A3This section contains quantitative analyses conducted on financial statements data of UK listed companies. The analyses aim to achieve several objectives:
- First, to provide further granular evidence on the prevalence of intangibles and goodwill in the UK to complement the evidence already gather by the UKEB on the topic.1 This report will investigate industry and size differences in greater detail, to obtain a fuller picture of the prevalence of intangibles among listed companies.
- Second, to corroborate the existence of two of the main concerns identified by stakeholders in the Qualitative Report by providing some empirical evidence. Namely:
- that IAS 38 Intangible Assets leads to inconsistent accounting between companies that grow by acquisition and companies that grow organically. By analysing the correlation between merger and acquisition (M&A) activity and the growth of gross intangibles/gross goodwill this section will provide some evidence in support of this concern.
- that the high threshold for recognition set by IAS 38, many potential intangible assets are currently unrecognised in the financial statements. This section will aim to quantify some of these missing intangible assets using a variety of techniques2.
- Third, to provide evidence that intangibles are positively correlated with companies' performance, using a variety of techniques (graphical evidence, correlation, regression analysis).
Prevalence of intangibles among UK listed companies
A4Both the Intangibles Qualitative Report and the Goodwill Report contain evidence on the prevalence of intangibles in the UK. This report plans to expand this evidence by:
- Focusing on the prevalence of intangibles and goodwill for all UK listed companies (as opposed to FTSE 350 companies only, analysed to date).
- Providing more granular evidence and analyses to identify industry and size trends.
A5The preliminary analyses presented in this appendix are based on FTSE 350 companies only. It will be expanded to include all LSE listed companies.
A6All data discussed in this section is taken from Reuters-Eikon.
Prevalence of intangibles
A7The following chart shows the amount of intangible assets on FTSE 350 companies balance sheets for the period 2011-20213:
Chart 1: Capitalized Net Intangible assets (excl. Goodwill)
(Bar chart showing Capitalized Net Intangible assets in Billions (£) from 2011 to 2021. Values rise from £150.70 in 2011 to £344.99 in 2021, with notable increases in 2016-2017 and 2019-2021.)
A8In 2021 capitalised intangible assets were worth £345 billion and have increased at an average rate of 9% YoY from 2011 to 2021. The large increase between 2016 and 2017 was mainly attributable to two large corporate acquisitions, each of which recognised significant intangible assets (Reckitt Benckiser acquiring Mead Johnson Inc., deal valued at £16 billion including brands of £9 billion and goodwill valued at £7 billion; British American Tobacco acquiring an outstanding stake in Reynolds American Inc, valued at £41.8 billion, subsequently recognizing £34 billion of goodwill and £75 billion in trademarks.
A9Perhaps unsurprisingly, intangible assets appear to be concentrated among the largest companies in the FTSE 350 index. The following chart shows intangible assets by quartiles of market capitalisation over the 2011-2021 period4:
Chart 2: Net Intangibles per quartile of market capitalisation
(Stacked bar chart showing Net Intangibles in Billions (£) for Quartiles 1-4 from 2011 to 2021. Quartile 4 (largest companies) consistently accounts for the vast majority of net intangibles, with total values increasing from around £135 billion in 2011-2013 to £318.48 billion in 2021.)
A10Data for the FTSE 350 companies suggests that on average, 89% of intangible assets were held by the largest companies, i.e., the ones in the fourth quartile (i.e., whose market cap is higher than the 75th percentile) of market capitalisation. So, in absolute terms, the largest companies are the ones that drive the general trend in intangible assets.
A11More granular analysis revealed that, in fact, most intangible assets are held by a handful of companies: the 11 companies with the largest amounts of recognised intangible assets hold nearly 70% of the intangible assets recognised by all FTSE 350 companies. This is illustrated in Chart 3 below.
Chart 3: 11 companies account for 69% of total intangible assets across FTSE 350
(Pie chart showing the distribution of intangible assets. "Top 11 Companies" account for 69%, while "Rest of FTSE 350 Companies" account for 31%. A bar chart details the top 11 companies: BAT (21%), AstraZeneca (9%), GSK plc (9%), Vodafone (5%), Unilever PLC (4%), Shell PLC (4%), London Stock Exchange (4%), Reckitt Benckiser Group PLC (4%), HSBC (3%), Lloyds (3%), Diageo PLC (3%).)
A12However, consideration of the share of intangible assets over total assets, highlights that, in relative terms, the largest companies do not invest more than smaller companies as shown in Chart 4.
Chart 4: Average share of net Intangibles to total assets per quartile of market capitalisation
(Bar chart showing the average share of net intangibles to total assets as a percentage, for Quartiles 1-4, from 2011 to 2021. Values fluctuate but generally show Q1 having a higher share than Q4 in most years, with Q1 at 11.67% and Q4 at 9.71% in 2021.)
A13In 2021, companies in the first quartile had a higher average share of intangibles than companies in the fourth quartile (i.e., whose market cap is higher than the 75th percentile). However, during that period, the share of intangibles over total assets tends to be comparable across different quartiles5.
A14Sectorial analysis did identify differences6 in the prevalence of intangible assets, as shown in Chart 5 and Table 1.
Chart 5: Net intangible assets by industry
(Bar chart showing Net intangible assets by industry in Billions (£) from 2011 to 2021. Major industries include Consumer Staples, Telecommunications, Health Care, Financials, Industrials, Energy, Basic Materials, Real Estate, Consumer Discretionary, and Technology. Consumer Staples is consistently high, reaching £121.86 billion in 2017 and £118.50 billion in 2021.)
| Industry | Capitalized Net Intangibles Assets (excl. GW) 2021 £ Bn. |
|---|---|
| Highest value | |
| Consumer Staples | 118.50 |
| Health Care | 64.27 |
| Financials | 52.73 |
| Consumer Discretionary | 27.40 |
| Telecommunications | 24.96 |
| Industrials | 21.08 |
| Energy | 20.67 |
| Technology | 5.84 |
| Basic Materials | 5.81 |
| Lowest Value | |
| Utilities | 3.66 |
| Real Estate | 0.08 |
A15The consumer staples, health care, financials, and consumer discretionary industries had the highest value of net intangibles in 2021. Analyses of financial statements showed that this is largely attributable to brand names, customer relationships, and patents.
A16As noted, the general increase of total reported intangible assets in the UK between 2016 and 2017 corresponded with large increases in intangible assets for the consumer staples and pharmaceuticals attributable to some high-value M&A deals.
A17The technology, basic materials, utility, and real estate industries had the lowest capitalized intangible assets in 2021. The technology industry may come as a surprise, though analyses of financial statement and disclosures reveal that while intangibles are an important driver of their competitive advantage, as they are largely internally generated, they cannot be recognised on the balance sheet as per IAS 38, and therefore are largely expensed.
A18These preliminary results support the stakeholders' view that IAS 38 creates inconsistent accounting between companies growing by acquisition and companies growing internally. Not only are industries where intangibles are expected to be crucial for their competitive advantage (as confirmed by an analysis of their financial statements and disclosures) are characterised by relatively few intangibles recognised on their balance sheets, but large acquisitions skew both the sectorial and total prevalence of intangible assets, a result that would not arise if the recognition of internally generated more widely permitted.
Quantitative analysis of intangibles among UK listed companies'
A19The financial statement analysis conducted on a sample of UK listed companies aims to achieve several objectives:
- Amounts and types of intangibles reported by UK companies in their financial statements;
- The nature and extent of disclosure by UK companies in their financial statements; and
- The relationship between management commentary on intangibles and the financial statements.
A20The analysis is based on a sample of 40 FTSE350 companies representing various sizes and industries. To obtain a diversity of industries and company sizes, we used a “stratified random sampling” method that divided the companies into four groups based on market capitalisation. We then selected an equal number of companies (10) from each group.
A21The table on the following page presents a very high-level overview of the industries captured in the sample.
| Sector | Number of companies |
|---|---|
| Alternative Energy | 1 |
| Automobiles and Parts | 1 |
| Construction and Materials | 1 |
| Consumer Services | 2 |
| Electronic and Electrical Equipment | 2 |
| Household Goods and Home Construction | 1 |
| Industrial Metals and Mining | 6 |
| Industrial Support Services | 3 |
| Industrial Transportation | 2 |
| Media | 3 |
| Medical Equipment and Services | 2 |
| Oil, Gas and Coal | 3 |
| Personal Goods | 1 |
| Pharmaceuticals and Biotechnology | 1 |
| Precious Metals and Mining | 3 |
| Retail | 2 |
| Software and Computer Services | 5 |
| Travel and Leisure | 1 |
A22The following statistics exclude goodwill.
- Of our sampled companies 37 of 40 reported at least one intangible asset under IAS 38 (92.5%) in their financial statements.
- The average percentage of intangible assets to total assets, based on entities who had reported intangible assets in their financial statements, was 18%. .
- The sector analysis highlighted that the industrial metals and mining sector represented the highest percentage of intangible assets in their financial statements at 43% of total assets on average, while the lowest percentage of intangible assets to total assets was represented by the construction sector at 1% of total assets on average.
Common types of intangible assets
A23The most common types of intangibles identified across the sample of entities that had disclosed intangible assets, were (NB: percentage represents: [number of companies in the sample disclosing the type intangible]/[all companies in the sample disclosing at least one intangible]):
- acquired software (43%),
- customer lists (38%),
- brands (25%),
- licenses (23%),
- capitalised development costs (under IAS 38) (20%), and
- trademarks (20%).
A24Other intangible assets identified in the financial statements included
- permits,
- customer contracts,
- supplier relationships,
- patents,
- internally generated software, and
- internal development programmes.
Disclosures related to intangible assets
Income statement
A25There is no consistent pattern of disclosures on the face of the income statement in relation to the amortisation of intangible assets. Some entities disclosed amortisation as a separate line item on the face of the financial statements, while others made no reference on the face of their financial statements. We are still analysing to see if materiality provides a clear explanation for these differences.
A26However, regardless of separate disclosure on the face of the income statement, entities made detailed disclosures in relation to amortisation of intangible assets in the accompanying notes.
Balance sheet
A27Majority of the entities in the sample disclosed intangible assets as a separate line item on the face of the balance sheet.
Notes to the financial statements
A28The majority of the entities made separate note disclosures regarding intangible assets, including a reconciliation of the opening and closing balances.
A29Entities that made acquisitions during the year generally provided relatively extensive disclosures of the intangible assets recognised from the business acquisitions. We are continuing to analyse these disclosures, particularly the types of assets recognised and at what value, as well as any additional information provided about the nature of the item and how it was valued.
Other areas of interest (front half of the annual report)
A30Training and development were disclosed by some entities as being a key part of their sustainability activities in the management commentary. However, entities also noted that costs related to training and development could not be capitalised due to the strict IAS 38 capitalisation requirements.
A31Some entities also reported that employee training and marketing costs were a key and strategic part of their continued growth and sustainability and were also drivers of revenue. However, costs related to such items were expenses through profit or loss and cannot be capitalised as intangible assets.
A32The audit reports of a few entities in the sample reported intangible assets as being a Key Audit Matter (KAM) for the 2021 year. KAM related to capitalisation and amortisation of development costs, and the possible overstatement of recognised research and development costs.
Footnotes
-
UKEB (2021), Subsequent measurement of goodwill: a hybrid model. UKEB (2021), [DRAFT] Accounting for intangibles: stakeholders’ views ↩↩
-
The evidence will be more systematic than the one provided in the Qualitative Report, where estimations were more piecewise and had largely illustrative purposes. ↩↩
-
Any discrepancies with the Intangibles Qualitative Report are due to trust and funds being excluded from the current analysis as well as subsequent updates to financial information, a notable one being intangible assets recognised by the LSE Group following the acquisition of Refinitiv/Tradeweb. ↩↩
-
For the year 2021 the quartile threshold were as follows: 25th percentile, £1.31 billion; 50th percentile (median), £2.35 billion; 75th percentile, £5.7 billion. ↩
-
In 2021, the ratio of net intangible assets to total assets was 11.67% for Q1 companies, 7.36% for Q2 companies, 6.36% for Q3 companies and 9.71% for Q4 companies. ↩
-
ICB industry classification. ↩